Breakoutwatch.com Suggested Strategy
Introduction
This strategy was developed using our Cup with Handle (CwH) (also known as cup and handle) backtest tool. It is based on the sequence of buy, hold and sell rules that would have returned the best performance over the period January 1 to September 30, 2015. As market conditions can change quickly, the strategy may require adjustment in the future. We usually re-adjust the strategy on a quarterly basis*. If market conditions do change, you can determine yourself if the strategy is still effective using the CwH backtest Tool.
The strategy does not require that you trade frequently, but it does require that you are able to react quickly when an alert is issued and that you monitor your portfolio each evening to reset sell orders.
Step 1: Determine Portfolio Size
How much of your capital are you willing to put at risk? To maximise returns, this strategy requires that you place all of your allocated capital on a single position. I'll explain why we do not spread our capital across multiple positions later. So first, determine how much you are willing to put at risk. Throughout this tutorial, we'll assume an initial capital of $10,000.
Step 2: Alerts
 The strategy uses only cup and handle
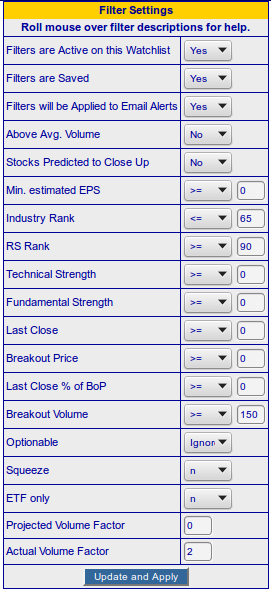
alerts that meet certain criteria. I suggest you set filters on the
CwH watchlist as shown. You access the filters from the Filter
Settings tab at the top of the watchlist. The objective is to only
receive alerts on stocks that meet the criteria: RS Rank >= 90,
average daily volume >= 100,000, and are in the top 30% of
industries. Note that alerts are only sent for stocks over $6 by
default and this can't be set lower. Setting the Actual Volume Factor to 2, ensures you will only receive an alert when the actual volume on breakout date is twice the 50 day average volume.
Save your filters and then go to the menu choice Take Action - Alerts > Alert Preferences and set the option "Send alerts for stocks meeting my watchlist filters only"
Step 3: Open Position(s)
Each day, check our market trend indicator for the NASDAQ Composite index. If the trend is down then do not open any positions.
Otherwise, when your first email alert arrives, immediately check the price with your broker and compare it to the breakout price for the stock. If the price quoted is above the breakout price but less than 5% above it, buy 100% of your available capital worth of the stock. Follow that immediately with a stop-loss order 6% below the breakout price. Breakouts don't always go straight up and there can often be some profit taking by traders after breakout which can cause a price dip.
Step 4: Monitor Position
That evening, check the volume reached during the day. If the volume did not exceed the 50 day average volume by at least 100% (2 times ADV), place an order to sell at the open next day, and return to step 2. Our daily Market Analysis and daily end-of-day email will report breakouts that met this volume threshold.
Otherwise, check the highest intraday price reached during the day. Now change your stop loss order to be 3% below the highest price. This will allow small corrections in the stock price but also protect your position against a heavy loss.
On each subsequent day, check the highest intraday price and if its higher than previously, reset your stop loss to 3% below the new high. Some brokers allow you to set an automatic stop less %
Step 5: Take Profit/Loss
Other than setting the daily stop loss as described, you do not need to fret over when to sell the stock because sooner or later you will be stopped out of your position by the 3% trailing stop.
Hopefully, your capital has increased but if not, do not despair, some drawdown is inevitable as not every position you open will be a winner. Now, return to step 2 and wait for the next alert that meets your filter values. This suggested strategy is designed to minimze your drawdown and as of September 30, 2015, the maximum drawdown was just 2.6%
Results for 2015
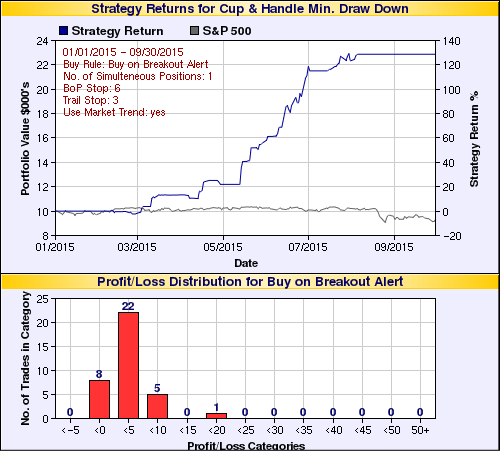
If you had followed this strategy from January 1 this year your portfolio would have gained 129%. These charts show how your portfolio value would have grown and that you would have made only 34 trades. Only 8 of them would have been losing trades

Why Only One Position
As we can see, there are not many breakouts that meet our buy criteria. If we wanted, say, a four position portfolio, we would allocate a quarter of our available capital to each position. However, because of the scarcity of stocks meeting our selection criteria, we would only rarely find four stocks to be invested in simultaneously. So we would be fully invested less often than with the one position portfolio and the opportunity to grow our capital would be greatly diminished.
* Crteria last adjusted for market conditions on 09/30/2015.