Stocks are placed on this watchlist if they meet the requirements of our Head and Shoulders Methodology (see below).
Column Headings |
Description |
| Symbol | Stock Symbol |
| Breakdown Price | Price at which the stock will break through either the neckline or a horozontal line drawn from the Left Shoulder. This is adjusted daily if the neckline is the breakdown price reference point. |
| Target Price | The target price after breakdown. Obtained by subtracting the 'target' from the breakdown price. In the case of an upward sloping neckline, the target is the difference between the neckline and intraday high on the day the head is formed. In the case of a flat or downward sloping neckline, the target is the difference between the intraday low at the left shoulder and the intraday high at the head. |
| Target % | The % decline that will be achieved if the target price is reached. |
| Last Close | The price at the last close. This will always be above the breakdown price. |
| Avg. Volume | The 50 day moving average volume. An alert is sent if the price falls to th ebreakdown price and projected daily volume (straight line projection to market close) is equal to or greater than the adv. |
| RS | The current RS rank of the stock. |
The head and shoulders pattern is recognized as one of the most reliable trend reversal patterns. Bulkowski* reports that 93% of these patterns continue to move downwards once a breakdown occurs. It forms after an uptrend and is characterized by three peaks with the center peak higher than the two adjoining peaks. The neckline is a line drawn between the two lows between the peaks.
Our own research and backtest results are in the Newsletter Archive.
We recognize two types of head and shoulder, depending on the slope of the neckline. We do this so we can recognize a breakdown price and issue alerts when this price is met.
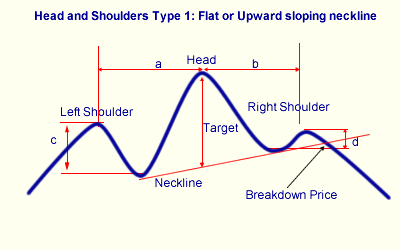
When the neckline is flat or slopes upwards, the breakdown price is calculated as the point where the neckline intersects the price line following formation of the right shoulder. It is at this point that the pattern is completed and a long position should be closed, or a short position opened. At this time we can calculate a 'target' decline which is the distance between the center peak's high and the neckline. Bulkowski* estimates this target is reached 63% of the time.
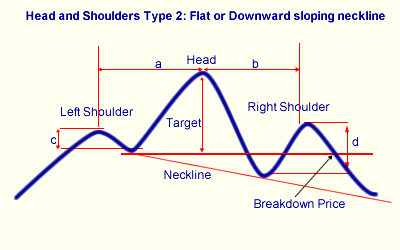
If the neckline slopes down, then it is possible that it will never intersect the price line following the right shoulder, so we use an alternative method of detemining a breakdown price. In this case we use the support level between the left shoulder and the head and calculate the target price as the difference between that support level and the center peak's high.
Pattern Recognition
Our algorithm will recognize a head and shoulders pattern when the following conditions are met.
- The stock must be in a confirmed up trend before the pattern begins. An uptrend exists if the the left shoulder is at least 30% higher than the low in the previous 6 months (120 trading days).
- The pattern width, shoulder-to-shoulder, must be 6 months (120 trading days) or less.
- The head must have occured within the last 6 months (120 trading days).
- There must be approximate symmetry to the pattern. We determine this by requiring that number days between the shoulders and the head (a and b in the diagram) must be within 50% of each other.
- There must be a noticeable trough between the left shoulder and the head (c). We chose an arbitrary minimum of 2%. This is measured from the left shoulder intraday high to the intraday high at the left neckline.
- There must be a noticeable trough between the head and the right shoulder (d). We chose an arbitrary minimum of 2%. This is measured from the right shoulder intraday high to the intraday high at the right neckline.
- For upward sloping necklines, the breakdown price is the the neckline value on the date of the last close.
- For flat or downward sloping neckline, the breakdown price is the value of the intraday low at the left neckline.
- The last close must be above the breakdown price.
- The minimum 50 day average volume must be at least 500,000. Stocks with greater liquidity are less likely to make sudden moves creating a short squeeze.