| Market Summary | Weekly Breakout Report | Top Breakout Choices | Top 2nd Chances | New Features | Tip of the Week |
Market Summary
We've talked about the risks to the market before, so this week's downturn came as no surprise. Every investor knew we were skating on thin ice but seemed in denial of the macro-economic realities. When Greenspan talked of a possible recession by year's end and Asian market's tumbled, skittish investor's headed for the exits. Bernanke did a yeoman's job of calming fears and talking up the economy but the realities of a slowing economy, sub-prime lending risks, falling home prices and revaluation of the Yen against the dollar were risks that could no longer be ignored and investors hastily priced them into stock valuations.
Where to from here? Was this week's market behavior rational or irrational? Does it matter? If you consider it irrational and bet against the market, then the market can continue to be irrational for longer than you can remain solvent (J. M. Keynes). Our market model (sober and rational) still says 'enter' but no model can anticipate external shocks such as arrived on Tuesday. Should we follow the model and bet against the market? I've considered manually intervening and changing the signal but decided against it. Instead I suggest holding existing positions but not entering new (long) ones. I expect the market will continue down in the medium term, because of the persuasive bear case made here, but there will likely be a short term recovery which you should sell into to recover some of your recent losses. Of course, there is always a case made by the bulls as well, without which we wouldn't have a market.
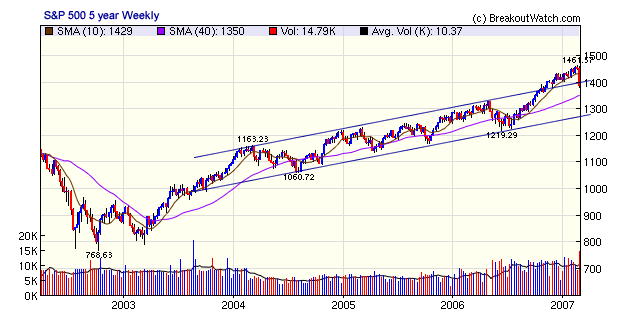
Although this week's fall was dramatic by the standards of recent history, the following 5-year chart of the S&P 500 puts it into perspective. We see that the index has returned to within its primary trend channel and that in fact, the last three months have been an aberration.

The index crashed through the 50 day moving average and if it fails to find support at the 200 dma level, then there will be worse to come. If we are at the start of a bear market, then there will likely be money to be made on the short side and we offer a round-trip short and cover strategy in this weeks top tip.
| Get a 14 day Trial of our premium 'Platinum'
service and TradeWatch for just $9.95 and if you subsequently subscribe
to any subscription level we will credit your $9.95 to your subscription.
14
Day Platinum Trial |
New TradeWatch Short Sale Features
Please see today's Top Tip below.
Recognizing that no market goes up for ever, we started work last year on strategies for trading short sales based on the head and shoulders top pattern. I'm very grateful for the assistance of subscriber DCPC (who modestly wishes to remain anonymous) who helped with strategy development and statistical analysis.
Opening the Short Position
We found that the conditions most favorable for opening a short position were when:
- the stock closed below the break down price
- the target price (as calculated by the H&S Top algorithm) was at least 12%
- the close price was below the PSAR value for that day. This tends to confirm that the stock is trending down
If these conditions are met, then the position can be opened at the next session. The potential profits on the trade can be improved by specifying a stop price at an additional discount to the break down price. We'll demonstrate that later.
Covering the Short Position
Short trades are risky. The trade often moves against you quite quickly as others who have also taken a short position cover their positions and it takes strong nerves to hold the position as the price moves back to and above your entry price. This is analogous to tolerating a short term loss on a long trade after breakout while waiting for the longer term gain. We used our experience in building the sell model for long trades to search for a cover strategy that worked for short trades with the hope of developing a 'sell at open' type strategy. We were not successful. Short trades have the potential to move so quickly to the upside that in many cases the profit could be lost with a cover at open strategy. So instead we looked for a strategy where a likely cover situation was developing so a cover price could be generated for the next session's trading. That allows a day only cover stop order to be issued for the next session.
The objectives of a successful cover strategy are two-fold: to protect the profits that may already be in the trade while at the same time allowing the trade to run to maximum profit. The rules we developed are:
- if RSI is less than 45 after close then a potential cover situation has emerged
- if the price rises to the projected PSAR for that day then cover
- if the above conditions have not been met and the price rises to 10% above the break down price, then cover.
Note that even if you cannot follow the market in real time, these rules allow you to give stop orders to your broker to cover the trade.
We also found that the profitability of the trade was improved if the normal PSAR calculation parameters were modified to increase the rate at which the PSAR descends after breakdown. This gives a lower cover price and therefore more profitability.
New TradeWatch Functions in Beta Test
The strategies described above can be implemented using our current head and shoulders pattern reporting features (with the exception of the modified PSAR formula) but to make it easier we are implementing the short trading strategies described above in TradeWatch. We've added two new functions: a 'Short at Open' list which each day will select stocks from confirmed head and shoulders breakdowns that meet the criteria described above, and a 'Cover Assistant' which, if checked nightly, will tell you what the cover price for the next day should be. Email cover alerts and historical reporting will be added in due course.
The Short at Open screen is accessed from the TradeWatch menu:

Notice that there are multiple stop prices given at 0.5% discount levels from the breakdown price. Using a discount price will reduce the number of trades filled, but increase the profitability. Results from our back testing are shown later.
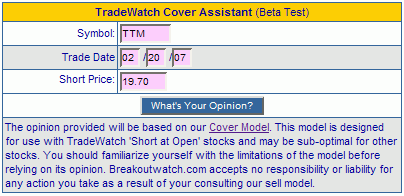
The Cover Short Positions screen is accessed from the Sell Assistant menu. It can be used for any stock, although the methodology was derived from back testing with our H&S Top model. The results may not be applicable to another shorting pattern.
Enter the trade opening conditions in the TradeWatch Cover Assistant Window and click the 'What's Your Opinion' button.

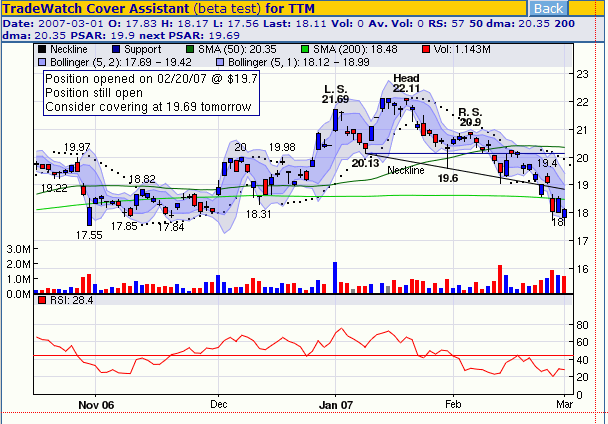
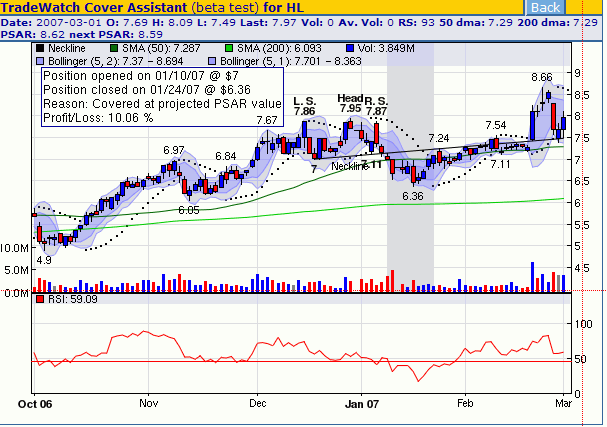
After a few moments an annotated chart will appear. If the stock was on our H & S Top watchlist then the head, shoulders,neckline and resistance lines will be shown.
If the cover model finds that the RSI is less than 45 then the stock may be ready to sell if the price rises to the level of the projected PSAR for the next day. The chart will be annotated with a suggested cover price.

If the RSI is not less than 45, then the stock may not be ready to be covered. Trading conditions on the next day may change dramatically, however.
If the cover model thinks the stock should already have been sold then the chart will show that.

In building the cover strategy we looked at stocks that met the H&S Top pattern and met the short trade entry criteria for 30 months from January, 2004 to June 2006. This was a bull market with some periods of consolidation but not generally favorable to short trading. The results we obtained with the strategies outlined were not impressive, but if followed consistently would have given a satisfactory return on investment. You can see that the profitability of each trade improves as the discount to breakdown price increases. However, the number of trades declines so there is less overall profit to be made. The strategies have not been tested on an in dependant set of data, so their robustness to different market conditions cannot be determined, and, as always, past performance is no guarantee of future returns.
| Discount % to BdP |
Number of Trades |
Profit % | # Covered at 10% Stop Loss |
# Covered at intraday PSAR |
Avg Days Open |
Overall Profit $10000/trade |
Annualized Return % |
|---|---|---|---|---|---|---|---|
0 |
176 |
1.43 | 14 | 162 | 12.89 | 25168 | 40.49 |
0.5 |
156 |
1.39 | 13 | 143 | 12.98 | 21684 | 39.09 |
1 |
126 |
1.67 | 8 | 118 | 12.59 | 21042 | 48.42 |
1.5 |
109 |
1.02 | 8 | 101 | 12.46 | 11118 | 29.88 |
2 |
90 |
0.78 | 7 | 83 | 12.07 | 7020 | 23.59 |
2.5 |
67 |
1.17 | 3 | 64 | 12.7 | 7839 | 33.63 |
3 |
57 |
1.59 | 3 | 54 | 12.98 | 9063 | 44.71 |
3.5 |
45 |
2.63 | 2 | 43 | 13.44 | 11835 | 71.42 |
4 |
34 |
2.69 | 2 | 32 | 13.44 | 9146 | 73.05 |
Investment Advisors Using our Service
TradeRight Securities, located in a suburb of Chicago, is a full services investment management company and broker/dealer. They have been a subscriber, and user, of BreakoutWatch.com for some time now. They practice CANTATA and use Breakoutwatch.com as a “research analyst”. You can learn more about TradeRight Securities at: www.traderightsecurities.com. If you’re interested in speaking to a representative, simply call them toll-free at 1-800-308-3938 or e-mail gdragel@traderightsecurities.com.
PivotPoint Advisors, LLC takes a technical approach to investment planning and management. A breakoutwatch.com subscriber since May, 2004, they use breakouts, market signals, and now TradeWatch to enhance returns for their clients. Learn more at http://pivotpointadvisors.net or contact John Norquay at 608-826-0840 or by email at john.norquay@pivotpointadvisors.net.
Note to advisors: If you would like to be listed here, please contact us. As a service to those who subscribe to us, there is no additional charge to be listed here.
| Get a 14 day Trial of
our premium 'Platinum' service and TradeWatch for just $9.95 and
if you subsequently subscribe to any subscription
level we will credit your $9.95 to your subscription.
14
Day Platinum Trial |
| Index | Value | Change Week | Change YTD | Market1 Signal |
||||||||||||||||||||||||||||||||||||
|---|---|---|---|---|---|---|---|---|---|---|---|---|---|---|---|---|---|---|---|---|---|---|---|---|---|---|---|---|---|---|---|---|---|---|---|---|---|---|---|---|
| Dow | 12114.1 | -4.22% | -2.8% | enter | ||||||||||||||||||||||||||||||||||||
| NASDAQ | 2368 | -5.85% | -1.96% | enter | ||||||||||||||||||||||||||||||||||||
| S&P 500 | 1387.17 | -4.41% | -2.19% | enter | ||||||||||||||||||||||||||||||||||||
1The Market Signal is derived from our proprietary
market model. The market model is described on the site. 2The site also shows industry rankings based on fundamentals, combined technical and fundamentals, and on price alone (similar to IBD). The site also shows daily industry movements. |
||||||||||||||||||||||||||||||||||||||||
# of Breakouts
|
Period Average1
|
Max. Gain During Period2
|
Gain at Period Close3
|
|
|---|---|---|---|---|
| This Week | 42 | 22.38 | -0.39% | -4.84% |
| Last Week | 39 | 23.69 | 5.26% | -3.41% |
| 13 Weeks | 382 | 24.54 | 9.65% |
-1.44% |
Sector
|
Industry
|
Breakout Count for Week
|
|---|---|---|
FINANCIAL SERVICES
|
Closed-End Fund - Equity
|
9
|
FINANCIAL SERVICES
|
Closed-End Fund - Debt
|
5
|
UTILITIES
|
Electric Utilities
|
3
|
BANKING
|
Regional - Southeast Banks
|
2
|
BANKING
|
Savings & Loans
|
2
|
AEROSPACE/DEFENSE
|
Aerospace/Defense Products & Services
|
1
|
BANKING
|
Money Center Banks
|
1
|
BANKING
|
Regional - Mid-Atlantic Banks
|
1
|
BANKING
|
Regional - Midwest Banks
|
1
|
BANKING
|
Foreign Money Center Banks
|
1
|
BANKING
|
Regional - Southwest Banks
|
1
|
CHEMICALS
|
Synthetics
|
1
|
COMPUTER SOFTWARE & SERVICES
|
Business Software & Services
|
1
|
COMPUTER SOFTWARE & SERVICES
|
Application Software
|
1
|
COMPUTER SOFTWARE & SERVICES
|
Information Technology
|
1
|
CONSUMER NON-DURABLES
|
Rubber & Plastics
|
1
|
HEALTH SERVICES
|
Home Health Care
|
1
|
LEISURE
|
Resorts & Casinos
|
1
|
LEISURE
|
Sporting Activities
|
1
|
MATERIALS & CONSTRUCTION
|
General Building Materials
|
1
|
MEDIA
|
Broadcasting - TV
|
1
|
TELECOMMUNICATIONS
|
Telecom Services - Foreign
|
1
|
TELECOMMUNICATIONS
|
Diversified Communication Services
|
1
|
2This represents the return if each stock were bought at its breakout price and sold at its intraday high.
3This represents the return if each stock were bought at its breakout price and sold at the most recent close.
Category |
Symbol |
Company Name |
Expected Gain1 |
|---|---|---|---|
| Best Overall | NAVI | Navisite Incorporated | 86 |
| Top Technical | FRK | Florida Rock Industries | 36 |
| Top Fundamental | BRCD | Brocade Communications | 67 |
| Top Tech. & Fund. | BRCD | Brocade Communications | 67 |
Category |
Symbol |
Company Name |
Expected Gain1 |
|---|---|---|---|
| Best Overall | NCIT | NCI Inc | 64 |
| Top Technical | STN | Station Casinos Inc | 34 |
| Top Fundamental | TRAK | DealerTrack Holdings Inc | 42 |
| Top Tech. & Fund. | TRAK | DealerTrack Holdings Inc | 42 |
If you received this newletter from a friend and you would like to receive it regularly please go to the BreakoutWatch.com site and enter as a Guest. You will then be able to register to receive the newsletter.
Copyright © 2007 NBIcharts, LLC dba BreakoutWatch.com. All rights reserved.
" BreakoutWatch," the BreakoutWatch.com "eye" logo, and the slogan "tomorrow's breakouts today" are service marks of NBIcharts LLC. All other marks are the property of their respective owners, and are used for descriptive purposes only.