| Market Summary | Weekly Breakout Report | Top Breakout Choices | Top 2nd Chances | New Features | Tip of the Week |
We anticipated last week that our market trend signal for the NASDAQ would turn down and that occurred on Friday when the index suffered its second successive distribution day.
Although the major indexes all closed higher for the week, the markets are rattled by doubts that the European bailout will solve the Euro-zone's problems in the long term, multiple investigations by Federal agencies and and NY State of the major Wall Street firms and disappointing forecasts from tech. leader CISCO and graphics chip supplier NVIDIA. While the domestic economic situation continues to improve, with better than expected retail sales and industrial production reports for April, there are real and justified fears that the recovery will continue to be slow and is threatened by the European situation and increasing levels of debt both there and at home.
Two links on Barry Ritholz's blog caught our attention today. If you have time over the weekend, have a look at these links - they will not cheer you up, but they do represent a sanguine view of the challenges facing the US and Europe.
Nassim Taleb on the mini-Crash
Victor Sperandeo on the European Bailout:
New Backtest Data shows Importance of Letting Winners Run and Cutting Losses
We know this to be true, but how often do we fail to do it because we lack the discipline to enforce it?
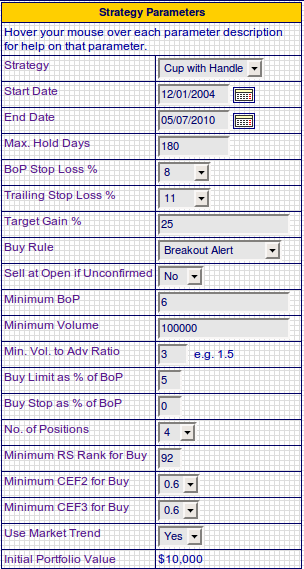
At the request of a subscriber, we have added a 'Target Gain %' to our CwH Strategy Backtest tool and as we shall see, it clearly shows that letting winners run while employing a rigid stop loss strategy pays off handsomely.
Firstly, we recall that we have previously shown (Factors Affecting Performance After Breakout) that the most successful breakouts from a cup-with-handle pattern have these characteristics:
- minimum RS Rank of 92
- CEF2 and CEF3 values of at least 0.6 (these metrics measure recent earnings)
- minimum breakout day volume of three times average volume
- other factors such as industry rank, rank in industry and other fundamentals are of little significance.
We have also found (Newsletter 3/12/10) that the money management technique of selling if the stock falls by 8% from the breakout price and taking profits with a trailing stop of 13%, optimizes returns when backtested over the last 5 years).
Our new parameter allows us to determine the optimum target percentage gain.
Using our previously determined values we ran the backtest for target gains of 10 - 75% with a portfolio size of four stocks. Here are the results:
| Target Gain | Stop Loss | Trail Stop | Adv Ratio | Initial Portfolio Value | Final Portfolio Value | Gain/Loss % |
|---|---|---|---|---|---|---|
| 10 | 8 | 11 | 3 | 10000 | 97,201.82 | 872.02 |
| 15 | 8 | 11 | 3 | 10000 | 102,420.18 | 924.2 |
| 20 | 8 | 11 | 3 | 10000 | 81,316.49 | 713.16 |
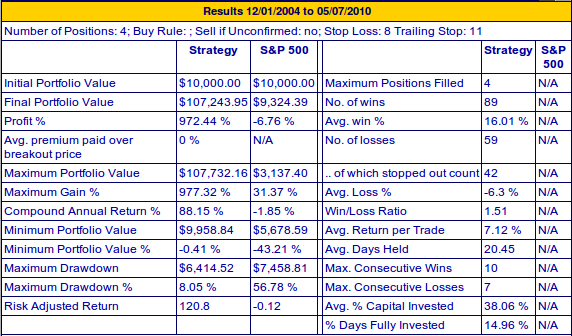
| 25 | 8 | 11 | 3 | 10000 | 107,243.95 | 972.44 |
| 30 | 8 | 11 | 3 | 10000 | 99,005.29 | 890.05 |
| 35 | 8 | 11 | 3 | 10000 | 65,408.52 | 554.09 |
| 40 | 8 | 11 | 3 | 10000 | 63,118.53 | 531.19 |
| 45 | 8 | 11 | 3 | 10000 | 60,303.23 | 503.03 |
| 50 | 8 | 11 | 3 | 10000 | 56,629.12 | 466.29 |
| 55 | 8 | 11 | 3 | 10000 | 56,411.38 | 464.11 |
| 60 | 8 | 11 | 3 | 10000 | 57,680.41 | 476.8 |
| 65 | 8 | 11 | 3 | 10000 | 58,962.42 | 489.62 |
| 70 | 8 | 11 | 3 | 10000 | 57,344.49 | 473.44 |
| 75 | 8 | 11 | 3 | 10000 | 49,120.19 | 391.2 |
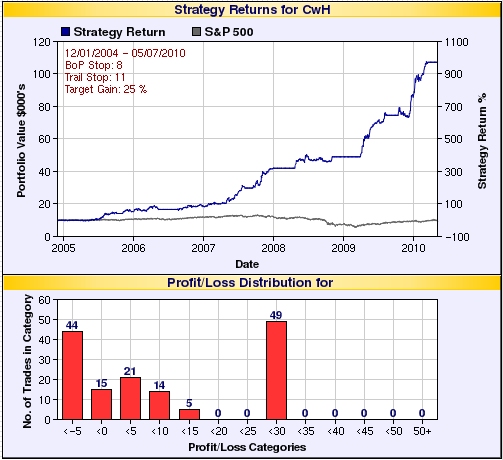
So we see that the optimum target gain is 25%. If we take profits then we free-up cash to buy our next potential winner. If we hang on for a bigger profit, we are either going to get taken out of the position by our trailing stop for less than our 25% gain, or we are missing an opportunity to make a more profitable trade.
Here are the screen shots for the simulation. You can try it yourself at http://www.breakoutwatch.com/Mike/cwhStrategyTest.php


| Index | Value | Change Week | Change YTD | Trend | ||||||||||||||||||||||||||||||||||||
|---|---|---|---|---|---|---|---|---|---|---|---|---|---|---|---|---|---|---|---|---|---|---|---|---|---|---|---|---|---|---|---|---|---|---|---|---|---|---|---|---|
| Dow | 10620.2 | 2.31% | 1.84% | Up | ||||||||||||||||||||||||||||||||||||
| NASDAQ | 2346.85 | 3.58% | 3.42% | Down | ||||||||||||||||||||||||||||||||||||
| S&P 500 | 1135.68 | 2.23% | 1.85% | Up | ||||||||||||||||||||||||||||||||||||
| Russell 2000 | 693.98 | 6.28% | 9.45% | Up | ||||||||||||||||||||||||||||||||||||
| Wilshire 5000 | 11876.3 | 2.74% | 3.29% | Up | ||||||||||||||||||||||||||||||||||||
1The Market Signal is derived from our proprietary
market model. The market model is described on the site. 2The site also shows industry rankings based on fundamentals, combined technical and fundamentals, and on price alone. The site also shows daily industry movements. |
||||||||||||||||||||||||||||||||||||||||
# of Breakouts |
Period Average1 |
Max. Gain During Period2 |
Gain at Period Close3 |
|
|---|---|---|---|---|
| This Week | 8 | 17.62 | 7.27% | 1.28% |
| Last Week | 8 | 17.69 | 15.87% | 8.31% |
| 13 Weeks | 235 | 18.31 | 20.36% |
3.06% |
2This represents the return if each stock were bought at its breakout price and sold at its intraday high.
3This represents the return if each stock were bought at its breakout price and sold at the most recent close.
Category |
Symbol |
Company Name |
Expected Gain1 |
|---|---|---|---|
| Best Overall | HL | Hecla Mining Co. | 109 |
| Top Technical | SWWC | Southwest Water Co. | 55 |
| Top Fundamental | SHFL | Shuffle Master Inc. | 80 |
| Top Tech. & Fund. | AMD | Advanced Micro Devices Inc. | 88 |
Category |
Symbol |
Company Name |
Expected Gain1 |
|---|---|---|---|
| Best Overall | SUMR | Summer Infant, Inc. | 100 |
| Top Technical | SUMR | Summer Infant, Inc. | 100 |
| Top Fundamental | SUMR | Summer Infant, Inc. | 100 |
| Top Tech. & Fund. | SUMR | Summer Infant, Inc. | 100 |
If you received this newsletter from a friend and you would like to receive it regularly please go to the BreakoutWatch.com site and enter as a Guest. You will then be able to register to receive the newsletter.
Copyright © 2010 NBIcharts, LLC dba BreakoutWatch.com.
All rights reserved.
"
BreakoutWatch," the BreakoutWatch.com "eye" logo, and the
slogan "tomorrow's breakouts today" are service marks of NBIcharts
LLC. All other marks are the property of their respective owners, and are
used for descriptive purposes only.
BreakoutWatch is not affiliated with Investor's Business Daily or with Mr. William O'Neil.
Our site, research and analysis is supported entirely by subscription and is free from advertising.