| Market Summary | Weekly Breakout Report | Top Breakout Choices | Top 2nd Chances | New Features | Tip of the Week |
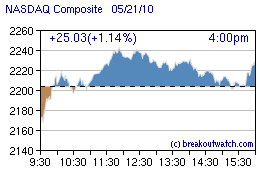
In volatile trading, the markets reversed at least twice on Friday to deliver gains of over 1% for each of the major indexes and accumulation days for the DJI and S&P 500. An intraday reversal is considered a possible signal of a market bottom so we may see the bounce continuing into next week. Another positive sign is that the index closed above its 200 day average.


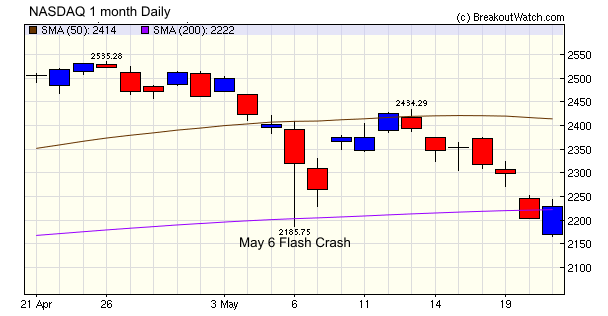
The sharp fall and quick recovery that day was almost certainly the result of a program trading feedback loop so today's sharp recovery from that day's low may also be the result of program trading. If so, it shows how difficult it is for the retail investor, not glued to their monitor, to play in this market. Our CwH backtest simulator (more below) shows that when our market trend signal is down, which it currently is for the NASDAQ and Russell 2000, it is best not to enter any new positions.
Volatility has been pronounced lately due to the European debt situation and also uncertainty about financial regulation at home. Although not resolved, the European situation has possibly stabilized now that the German parliament has endorsed the bailout package. Additionally, although the Senate and House finance bills have to reconciled, the broad outlines of the new regulatory environment are now known (see this NY Times article for a useful summary of what's in the legislation - too bad reinstatement of Glass-Steagall was not included).
Against this background, the short term outlook is for reduced volatility and a recovery from the present oversold condition but as long as the debt problem overhangs Europe and the US, which is likely to be for a long time to come, the long term trend may be downwards.
Last week we discussed the optimum target gain % for cup-with-handle breakouts. By optimum target % we meant at level should we take profits and move on to our next breakout opportunity. If we take profits too soon, we miss out on some extra gains but if we get too greedy and hold out for more gain, we pay an opportunity cost because we missed buying a better performing breakout. You will recall that our conclusion was that the optimum target % was 25%. This was assuming that we selected breakouts which met our target criteria (see Factors Affecting Performance After Breakout).
The question we answer this week is "how long should I hold onto a breakout before taking profits?".
This question arises because just as holding on for a higher percentage gain can create an opportunity cost, so can holding on too long. Clearly, the gain a stock will make is related to how long we hold it, so we need to find the optimum combination of hold days and target %.
To find this sweet spot we ran our simulation for hold periods from 10 to 360 days in 10 day increments and target gains of 10% to 75%. Other parameters were held constant. Our complete set of parameters were:

The results surprised us!
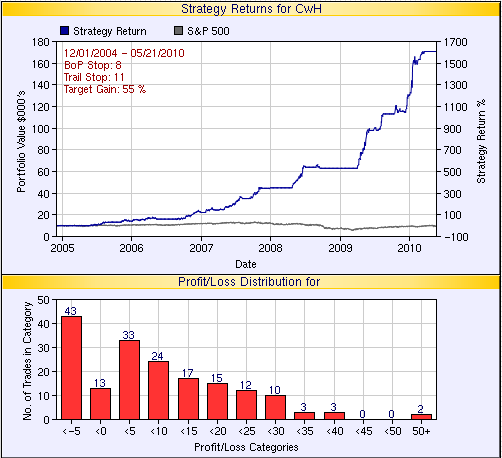
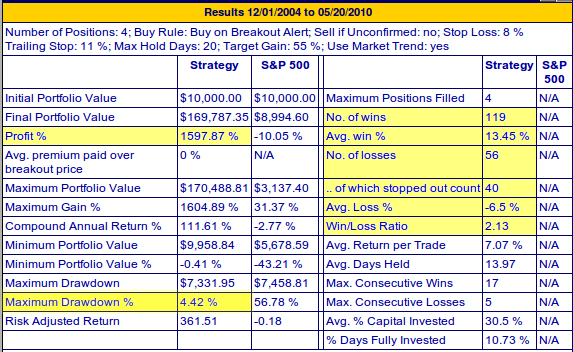
We found that the optimum hold days was just 20 and the optimum target gain% had moved up to 55% with a compound gain of over 1600% (compared to over 900% with a 180 day hold and 25% target).
Here is the strategy output as of Friday, May 21, 2010.

This also proves to be a very low risk strategy. The detailed results show that the maximum drawdown was only 4.4%. So at no time during the 4 1/2 years of the strategy backtest had we lost more than 4.4% of our portfolio value and this was during one of the most extreme bear markets in memory. We we've highlighted the important statistics in the table of results.

Conclusion
We can now state our recommended cup-with-handle strategy:
- Buy stocks that meet our target criteria (see below) when breaking out on at least 3 times average daily volume as close to the breakout price as possible (use our alerts for this).
- Sell them immediately:
- they fall to 8% below their breakout price, or
- they fall 11% from their most recent high, or
- they have gained at least 55% above their breakout price, or
- you've held the position for 20 sessions
- Stocks that meet our target criteria get the thumbs up (
 ) on
our watchlists and alerts.
Backtest Data Considerations
Our backtest database for the simulation contains 19,000 data points of
stocks that were on our CwH watchlist since December, 2004. This is a
very sizable sample and covers a highly volatile period for the
markets. The results of any backtest run over this database are highly
susceptible to the sequence in which the data appears and the period
over which compounding occurs. This can be seen by varying the periods
over which the backtest is run. Because the sequence in which the
breakouts occur in the historical data base and the market conditions
under which each breakout occurred is unlikely to be exactly repeated
in the future, the backtest results only indicate what would have
happened if the selected strategy had been followed over the time
period of the simulation, and cannot predict how the tested strategy is
likely to perform in the future. Nevertheless, because of the size of
the database, the simulation offers a valuable opportunity to test
strategies over a set
of very diverse conditions, both favorable and highly unfavorable to
the retail investor.
| Index | Value | Change Week | Change YTD | Trend | ||||||||||||||||||||||||||||||||||||
|---|---|---|---|---|---|---|---|---|---|---|---|---|---|---|---|---|---|---|---|---|---|---|---|---|---|---|---|---|---|---|---|---|---|---|---|---|---|---|---|---|
| Dow | 10193.4 | -4.02% | -2.25% | Up | ||||||||||||||||||||||||||||||||||||
| NASDAQ | 2229.04 | -5.02% | -1.77% | Down | ||||||||||||||||||||||||||||||||||||
| S&P 500 | 1087.69 | -4.23% | -2.46% | Up | ||||||||||||||||||||||||||||||||||||
| Russell 2000 | 649.29 | -6.44% | 2.4% | Down | ||||||||||||||||||||||||||||||||||||
| Wilshire 5000 | 11338.8 | -4.53% | -1.38% | Up | ||||||||||||||||||||||||||||||||||||
1The Market Signal is derived from our proprietary
market model. The market model is described on the site. 2The site also shows industry rankings based on fundamentals, combined technical and fundamentals, and on price alone. The site also shows daily industry movements. |
||||||||||||||||||||||||||||||||||||||||
# of Breakouts |
Period Average1 |
Max. Gain During Period2 |
Gain at Period Close3 |
|
|---|---|---|---|---|
| This Week | 4 | 17.15 | 10.07% | -2.4% |
| Last Week | 8 | 17.62 | 8.12% | -6.17% |
| 13 Weeks | 238 | 17.92 | 19.06% |
-4.93% |
2This represents the return if each stock were bought at its breakout price and sold at its intraday high.
3This represents the return if each stock were bought at its breakout price and sold at the most recent close.
Category |
Symbol |
Company Name |
Expected Gain1 |
|---|---|---|---|
| Best Overall | NOVL | Novell Inc. | 105 |
| Top Technical | NGA | North American Galvanizing & Coatings Inc. | 71 |
| Top Fundamental | MELI | Mercadolibre, Inc. | 52 |
| Top Tech. & Fund. | MELI | Mercadolibre, Inc. | 52 |
Category |
Symbol |
Company Name |
Expected Gain1 |
|---|---|---|---|
| Best Overall | ml PUBLIC "-//W3C//DTD HTML 4.01//EN" "http://www. | ||
| Top Technical | ml PUBLIC "-//W3C//DTD HTML 4.01//EN" "http://www. | ||
| Top Fundamental | ml PUBLIC "-//W3C//DTD HTML 4.01//EN" "http://www. | ||
| Top Tech. & Fund. | ml PUBLIC "-//W3C//DTD HTML 4.01//EN" "http://www. |
If you received this newsletter from a friend and you would like to receive it regularly please go to the BreakoutWatch.com site and enter as a Guest. You will then be able to register to receive the newsletter.
Copyright © 2010 NBIcharts, LLC dba BreakoutWatch.com.
All rights reserved.
"
BreakoutWatch," the BreakoutWatch.com "eye" logo, and the
slogan "tomorrow's breakouts today" are service marks of NBIcharts
LLC. All other marks are the property of their respective owners, and are
used for descriptive purposes only.
BreakoutWatch is not affiliated with Investor's Business Daily or with Mr. William O'Neil.
Our site, research and analysis is supported entirely by subscription and is free from advertising.