(Click menu items for further help)
The TradeWatch section of our site is designed to provide subscribers with a fully self-contained service for selecting, buying and selling stocks derived from our main cup-with-handle watchlist. An important, and valuable, feature of this service is that we provide specific instructions for buy and sell orders that you can place with your broker prior to market open. You do not need to be able to monitor the market in real time to benefit from our TradeWatch strategies.
There are four components to this service accessed from the TradeWatch menu-bar at the top of the TradeWatch page.
![]()
(Click menu items for further help)
1. "TradeWatch": watchlists of stocks which our research has shown will give the best returns for four kinds of trading styles:
These lists are carefully compiled based on our four years experience in selecting and monitoring breakout stocks. They are highly selective and on any day there will be only a few, if any, stocks on these lists. They are selected to give the best return over the designated time horizon.
The criteriia for selecting stocks for each of these lists is descibed below.
2. "TradeWatch History": a 'History' list of stocks on each list with access to performance, charts and technical sell recommendations
3. "Sell Assistant": this applies our Sell Model to any stock which you provide to it and provides an opinion on when and if the position should be liquidated. If the Sell Assistant considers the position should still be open, it will ask if you want to establish a sell alert on the stock.
4. "Sell Alerts": a service which will send an email when any stock that you have designated either meets your target price, falls to your stop loss price or is given a sell signal by our Sell Model as of the market close.
TradeWatch Stock Selection Criteria
Criteria for Buy on Breakout List
This list is obtained using filters described in our newsletter of 11/12/05 and augmented with the results of additional unpublished research. This research showed that there were some components of our CE (CANTATA Evaluator) that are not accessible through our watchlist filters that could be used to further improve the probability of breakout and longer term returns. The list also includes a recommended bid price based on the buy strategy we suggested at the end of that article. To get the best returns from this list a buy/stop order should be entered before the market opens so a fill price closest to the bid price is obtained. We also suggest using a limit of, say, 10c higher than the bid, so you do not get filled if the stock gaps up substantially over the breakout price. The historical results (accessible from the TradeWatch History menu or 'View History' button) are based on a buy/stop/limit order using these constraints. (Note: this list was formerly called the 'Best Return' list).

Criteria for Swing Trade List
This list is compiled using filters optimized to give the best return over a five day period. Note that the bid price is usually below the breakout price so that the maximum return can be obtained. It therefore includes stocks that have a high probability of breaking out. Stocks bought using this strategy can be held, even if the breakout is not confirmed and the results given under the 'View History' list reflect that. The Gain/Loss is calculated on the assumption that the stock is sold at the highest close within 14 days following opening the position.
Criteria for Day Trade List
This list is compiled using filters optimized to give the best one day return. Note that the bid price is usually below the breakout price so that the maximum return can be obtained. It therefore includes stocks that have a high probability of breaking out. The results shown in the 'View History' assume that the position is closed at the stock's high of the day.
Criteria for Buy at Open List
This list is compiled from stocks that broke out from the most recent watchlist and have an expected gain of at least 75% as calculated by our Expected Gain model. This model uses the ratio of breakout day volume to the 50 day average volume to improve the expected gain over that which can be calculated before breakout. The list shows the breakout price and suggested buy stop of 5% over the breakout price.
Criteria for Short at Open List
This list is compiled from stocks that broke down from the most recent Head and Shoulders Top pattern. The criteria for placement on this list are: stock must have closed below its breakdown price; the close must be below the PSAR value at the day's close (to confirm that it is in a shorting position) and the target price after breakdown must be at least 12% below the breakdown price. For information on the H & S Top pattern go here.
Each TradeWatch list has an associated TradeWatch History accessed from the TradeWatch History menu choice. Each history is divided into 'Trades Filled' or 'Trades Not Filled'.

Trades Filled
Clicking the 'Trades Filled' choice brings up a list of stocks that would have been bought from the list over the last 12 months and a summary of the possible returns that would have been obtained. The list is in reverse date order. Clicking the symbol shows a Technical Analysis Chart of the CwH pattern as it was when the stock would have been on the list and its subsequent performance. The filter values at that time can also be seen. The Gain/Loss is calculated on the assumption that the stock is sold at the highest close following opening the position.

For Buy on Breakout and Buy at Open stocks, extra columns are added to show the returns given using the Sell Model with no stop loss percentage.
When clicking the symbol, the resulting T/A Chart will use your stored T/A Preferences, if any (which can include a stop loss %). The T/A chart will also use the Sell Model results to show a sell point if any. The Sell Model will use a default stop loss of 8% unless you have stored a different stop loss preference. The stop loss can be removed by setting the 'Stop Loss' to 99 in the chart control panel and the chart redrawn. If the Sell Model does not find a sell signal, you can set up a sell alert by clicking the 'Create Sell Alert Button'. Setting up the Alert is described below.
![]()
Trades Not Filled
Clicking the 'Trades Not Filled' choice brings up a list of stocks that would not have been bought using the suggested buy/stop/limit parameters. It shows the suggested buy stop and the day's range.

Portfolio Simulation
This module allows you to simulate the performance that a portfolio of TradeWatch stocks would have returned over time periods that you select. The screen used to run the simulation is self-explanatory.

Portfolio Simulation Results
The results are displayed as follows. Click the "View Full Simulation" button to see how trades were selected to buy and sell. Click the "View Trades Only" to see just the trades that were made.

The Sell Assistant uses our Sell Model (see Sell Model Methodology) to determine if it thinks it is time to sell yet. By completing the form below and clicking the 'What's Your Opinion' button, we will produce a chart of the stock and if the Sell model thinks you should have sold it already, it will annotate the chart with the sell signal date and calculate a return based on the next day's opening price. Note that the Sell Assistant does not use a stop loss figure, but relies on its internal model to determine when to issue a sell signal. The Sell Assistant can be used for any stock, although it is only useful on stocks that were in a confirmed uptrend on the date of purchase.

If the Sell Model does not find a sell signal, you can click the 'Create Sell Alert' button and create a sell alert. You now have several options:

Once a Sell Alert is established as described above, your sell alerts can be viewed by choosing 'Sell Alerts' from the menu bar. This will show the status of all the alerts you have established. If an alert was issued then the Sell Signal Date, close price and gain/loss information will be displayed. Sell Alerts are acted on each day after the market close and you will be sent an email if the close is equal to or below your stop loss price, or the close meets or exceeds your Target Price or the Sell Model computes a sell signal at that time. Once an alert email has been sent, the sell alerts system will consider your position closed and will not send further alerts. For example, if you entered a stop loss value and the day's close is at or below that level you will be sent an email regardless of whether the sell model signals a sell or not. If the Sell Model subsequently signals sell, you will not receive another alert at that time.
Alerts can be edited by clicking the icon in the Edit Alert column.
Alerts can be removed from the list by placing a check in the 'Cancel Alert' column and clicking the 'Cancel Selected Alerts' button.

The Sell Model is the 'intelligence' behind the Sell Assistant' (see Sell Model Methodology). Invoking the Sell Model will produce an annotated T/A Chart showing buy points and sell signals. You can invoke the Sell Model in two ways:
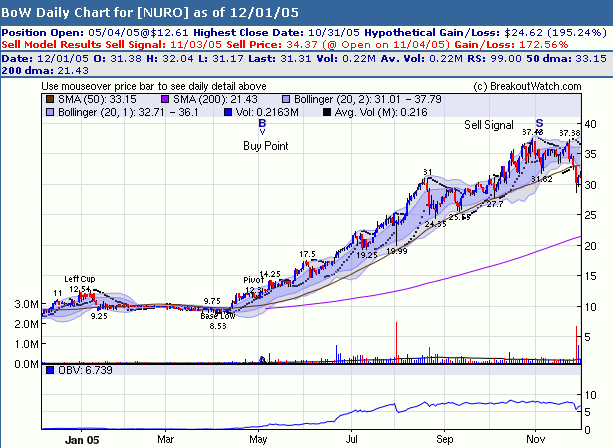
Sell signals are generated based on the closing price and where a historical Gain/Loss is calculated, the opening price on the day following the signal is used. Here's an example of a breakout that would have given a great return using the sell model:

The annotation on the chart shows the theoretical best return possible and the return that would have been given by our sell model. Of a theoretical maximum gain of 195%, the sell model captured a 172% gain. The chart shows Bollinger Bands, Parabolic SAR and On Balance Volume because these are components of the sell algorithm. We will return to these later, but an understanding of them is not necessary to use the sell model.
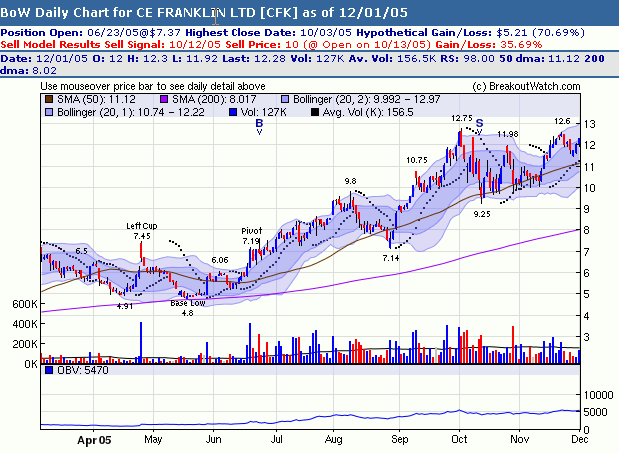
The model doesn't always produce such outstanding results, as the next one shows. Of a theoretical 70% gain, only half that was actually achieved.

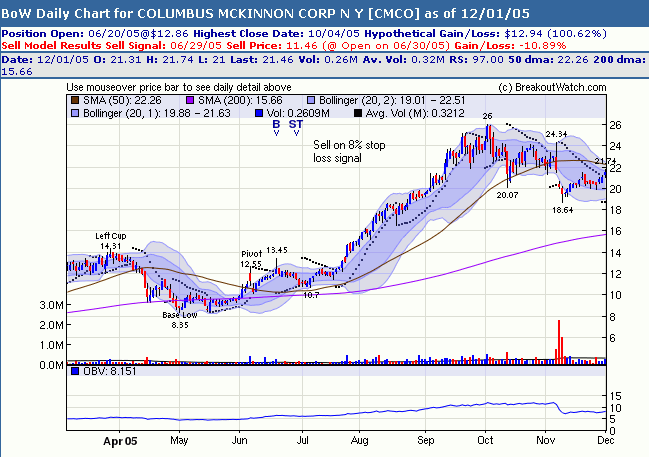
If a stop loss is used to issue a sell signal, the chart is annotated with an 'ST' to show the stop signal. In the case of CMCO, an 8% stop loss cost a potential gain of 100%:
 :
:
If you had relied on our sell model instead of an automatic stop loss, you would have turned an 11% loss into a 78% gain, as follows:

The Sell Model uses a three step process to determine if a sell signal should be issued:
Close Position |
Score |
above the +2 sd band |
+2 |
between the +1 sd and +2 sd bands |
+1 |
between the +1 and -1 sd bands |
0 |
between the -1 and -2 sd bands |
-1 |
below the -2 sd band |
-2 |
The following chart of CVO for December 2005 shows the application of the model where a sell signal was not issued and one where it was. For the purposes of illustrating the methodology, the position of the day's close relative to the Bollinger Bands is shown across the top of the chart.

This methodology is based entirely on our own original research. We found that the BB Bands and PSAR indicators alone or in combination gave exit signals that were too early and many strong gains were missed. We looked at other non-correlated indicators such as the RSI for confirmation but found using the PVO Divergence gave the best results. Since we use volume as an indicator of when to buy a breakout, it is logical that we should also consider volume when deciding when to sell.
Cover Short Positions (in beta Test)
The Sell Assistant -> Cover Short Positions invokes our cover model methodology to assist you in the when to cover a short position. It can be used for any stock, although the methodology was derived from backtesting with our H&S Top model. The results may not be applicable to another shorting pattern.
Enter the trade opening conditions in the TradeWatch Cover Assistant Window and click the 'What's Your Opinion' button.

After a few moments an annotated chart will appear. If the stock was on our H & S Top watchlist then the head, shoulders,neckline and resistance lines will be shown.
If the cover model finds that the RSI is less than 45 then the stock may be ready to sell if the price rises to the level of the projected PSAR for the next day. The chart will be annotated with a suggested cover price.

If the cover model thinks the stock should already have been sold then the chart will show that.

If the RSI is not less than 45, then the stock may not be ready to be covered. Trading conditions on the next day may change dramatically, however.
The cover model works by looking for a combination of RSI,
PSAR and stop loss conditions.
If the RSI at the close is < 45 then there is a possible
cover situation the next day. If during the next day the price rises to the projected
PSAR level then suggests to cover at that price.
Before these conditions are met, the stock may rise above the price at which the position was opened before falling again. Our backtesting showed that the best overall results were obtained by allowing a 10% rise (stop loss). The most difficult thing for a trader will be to tolerate the stop loss level necessary to achieve positive returns. We found that one must let the close price float up to 10% above the Breakdown Price before covering otherwise the potential gains from the trade are lost. In that case the cover price is the open the next day.
When calculating the PSAR following the break down date (or buy date) the formula used differs from standard to accelerate the parabolic descent.
This service is included in Platinum subscriptions.