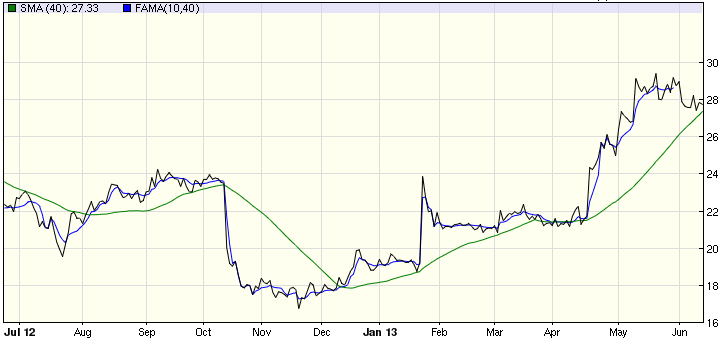
Fractal Moving Averages
The application of fractals to stock data was first publicized by John Ehler. (see FRAMA). John attempted to solve the problem of whipsaw trades which are always generated by static moving average crossover indicators, such as MACD. The problem with these indicators is that during periods of consolidation, when the stock is not trending, they generate too many signals as they respond to daily price fluctuations, and because there is always an inherent lag, the indicators generate losing trades. Fractal Moving Averages overcome this problem by being smoother (i. e . less reactive) during periods of consolidation but change more rapidly when the stock under study is trending.