Double Bottom Watchlist Methodology
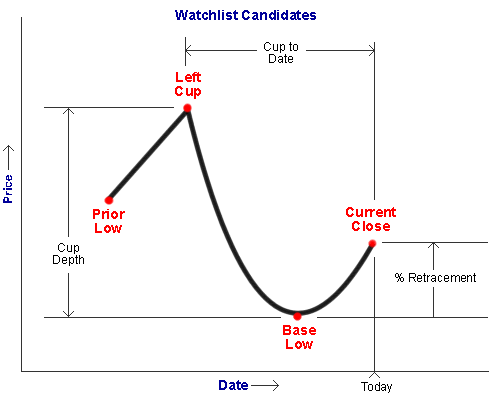
1. The Double Bottom is a special case of a general cup pattern so we start off by looking for cups meeting certain minimum criteria.

Double Bottom Watchlist Candidate Criteria
| Item |
Definition |
Criteria |
|---|---|---|
| Current Close | Current closing price as of the date the watchlist is prepared. | >=$6 and >= 95% of 200 day moving average |
| Average Daily Volume | The average daily trading volume per day over the prior 50 trading days. | >=30,000 |
| RSRank | The stock’s weighted price appreciation over the prior year, as ranked against all other stocks in our database. | >=60 |
| Left Cup | Highest intraday high that marks the beginning of the correction. | none |
| Prior Low | Lowest intraday low prior to the Left Cup. | Rise from Prior Low to Left Cup >=30% |
| Base Low | Lowest intraday low within the Cup. | None |
| Cup Depth | Difference between the Left Cup and Base Low, expressed as a percentage of the Left Cup. | <=60% |
| % Retracement | Percent of the Cup Depth the stock has risen above the Base Low. For example, a stock which has fallen from Left Cup = 100 to Base Low = 45 has corrected (100-45) = 55 points. A 38% retracement requires that the stock recover 38% of the 55 points lost, or (0.38)*55 = 20.90 points. In this example, to meet the criteria, the Current Close must be >= Base Low + retracement, or >= 45 + 20.90, or >= 65.90. | Current Close >= 38% Retracement from Base Low |
| Cup to Date | Trading days between Left Cup and Current Close. | >= 25 days and <=325 days |
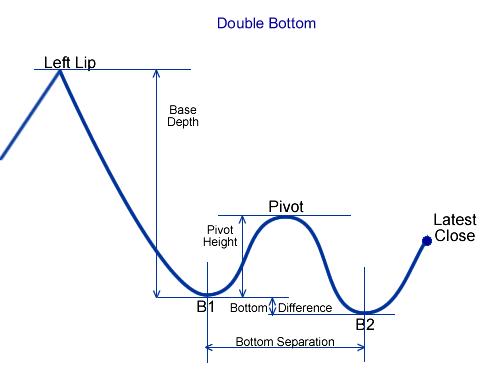
2. Next we filter the set of candidate stocks with the specific criteria for a Double Bottom Pattern.

Double Bottom Criteria
| Item |
Definition |
Criteria |
|---|---|---|
| RSRank | Relative Strength Rank. The stock’s weighted price appreciation over the prior year, as ranked against all other stocks in our database. | >=70 |
| Base Depth | Price fall from the left lip to the first bottom (B1) expressed as a percentage of.the height of the left lip. | <= 60% |
| Pivot Height | The center peak of the base is called the pivot. The pivot height is measured from the first bottom as a percentage of the Base Depth | > 10% and <= 105% |
| Bottom Difference | The difference between
the two intraday lows that form the double bottom measured as a
percentage of the first bottom. |
<= 4% |
| Bottom Separation | The number of trading days separating the two bottoms | >= 10 days |
© breakoutwatch.com 2015. All Rights Reserved.