| Market Summary | Weekly Breakout Report | Top Breakout Choices | Top 2nd Chances | New Features | Tip of the Week |
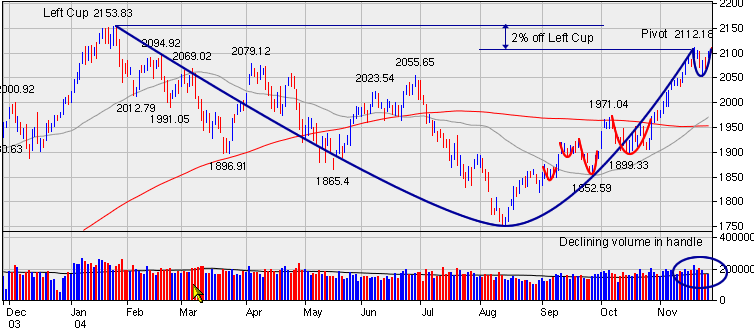
Last week we concluded that the rally was not over so we were pleased to see the markets close higher again this week. Volume was below average, as was expected because of the Thanksgiving holiday. The NASDAQ was again the best performing index of the week, with a gain of 1.51%. The NASDAQ is now in a cup-with-handle formation with the pivot just 2% below the left cup, which was also the high for the year. This is the fifth handle the index has formed since we issued our last enter signal on August 18 and the chart below traces the index's dramatic rise since then. The current handle is well formed with declining volume, as we like to see, and a support level was established at 2052.8 on Monday. If the index breaks out to a new high next week, there is one more resistance level at 2154 before the index reaches its highest level since June of 2001.
12 Month Chart of NASDAQ Composite Index

There is concern over the falling dollar and the implications for the equities and bond markets, coupled with rising energy costs and their potential impact on the economy. However, as long as our market signals continue at 'enter' then we see no reason not to continue to ride the current trend. When the signals change, we will have missed the precise market top, but trying to anticipate the top beforehand could lead to missed opportunities for further gains if the rally continues.
The number of breakouts fell again this week but they comfortably beat the market once again with an average gain of 3.48% compared to the NASDAQ's 1.51%. BXG was the star performer with a gain of 13.80% since its breakout on Tuesday.
Healthcare continued to be the most active sector for breakouts with 6 confirmed breakouts this week.
Be sure to read our Top Tip this week to learn how to find high quality cup-with-handle charts with large potential gains in less than two minutes. This includes an analysis of the strengths of some of the best charts from Tuesday's CH watch list.
| Index | Value | Change Week | Change YTD | Market1 Signal |
||||||||||||||||||||||||||||||||
|---|---|---|---|---|---|---|---|---|---|---|---|---|---|---|---|---|---|---|---|---|---|---|---|---|---|---|---|---|---|---|---|---|---|---|---|---|
| Dow | 10522.2 | 0.62% | 1.08% | enter | ||||||||||||||||||||||||||||||||
| NASDAQ | 2101.97 | 1.51% | 4.75% | enter | ||||||||||||||||||||||||||||||||
| S&P 500 | 1182.65 | 1.05% | 6.69% | enter | ||||||||||||||||||||||||||||||||
1The Market Signal is derived from our proprietary
market model. The market model is described on the site. |
||||||||||||||||||||||||||||||||||||
# of Breakouts
|
Period Average1
|
Max. Gain During Period2
|
Gain at Period Close3
|
|
|---|---|---|---|---|
| This Week | 34 | 45.08 | 5.54% | 3.48% |
| Last Week | 39 | 44 | 8.88% | 5.43% |
| 13 Weeks | 584 | N/A | 16.08% |
10.53% |
Sector
|
Industry
|
Breakout Count for Week
|
|---|---|---|
Computer
|
Computer-Integrated Sys
|
2
|
Healthcare
|
Healthcare-Instruments
|
2
|
Healthcare
|
Healthcare-Biomed/Genetic
|
2
|
Insurance
|
Insurance-Prop/Casualty/TItl
|
2
|
Internet
|
Internet-ISP/Content
|
2
|
Real Estate/ REIT
|
Real Estate Development
|
2
|
Aerospace & Defense
|
Aerospace & Defense-Equip
|
1
|
Banks
|
Banks-Foreign
|
1
|
Business Services
|
Business Svcs-Sec/Safety
|
1
|
Business Services
|
Business Svcs-Staffing
|
1
|
Chemical
|
Chemical-Basic
|
1
|
Chemical
|
Chemical-Plastics
|
1
|
Computer
|
Computer-Services
|
1
|
Containers
|
Containers
|
1
|
Electronics
|
Electr-Semicndtr Mfg
|
1
|
Finance
|
Finance-Invest Management
|
1
|
Healthcare
|
Healthcare-Products
|
1
|
Healthcare
|
Healthcare-Drugs/Ethical
|
1
|
Insurance
|
Insurance-Life
|
1
|
Leisure
|
Leisure-Htls/Mtls
|
1
|
Machinery
|
Machinery-Const/Mining
|
1
|
Metal Prds
|
Metal Prds-Pipe/Fab/Misc
|
1
|
Office
|
Office-Supplies
|
1
|
Pollution Control
|
Pollution Control-Equip
|
1
|
Retail
|
Retail-Computers/Mobile
|
1
|
Steel
|
Steel -Producers
|
1
|
Telecomm
|
Telecomm-Equipment
|
1
|
Utility
|
Utility-Electric
|
1
|
2This represents the return if each stock were bought at its breakout price and sold at its intraday high.
3This represents the return if each stock were bought at its breakout price and sold at the most recent close.
Category |
Symbol |
Company Name |
Expected Gain1 |
|---|---|---|---|
| Top Technical | OBIE | Obie Media Corporation | 72 |
| Top Fundamental | CCBI | Commercial Capital Bancorp, Inc. | 54 |
| Top Tech. & Fund. | CCBI | Commercial Capital Bancorp, Inc. | 54 |
Category |
Symbol |
Company Name |
Expected Gain1 |
|---|---|---|---|
| Best Overall | REDF | Rediff.com India Limited | 104 |
| Top Technical | GTOP | Genitope Corporation | 61 |
| Top Fundamental | MRCY | Mercury Computer Systems | 53 |
| Top Tech. & Fund. | MRCY | Mercury Computer Systems | 53 |
We introduced a new format for our email alerts this week, which are new distributed in HTML format.
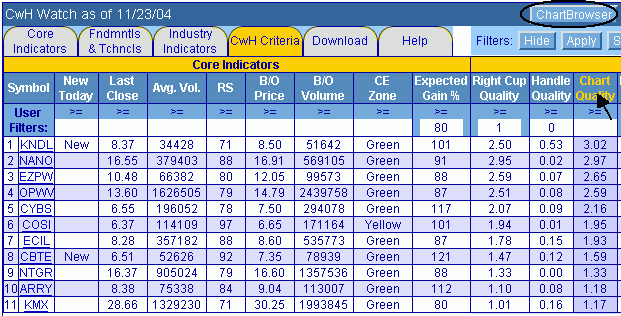
Use Filters to Find Quality Charts with High Expected Gain
Our site offers many ways to find 'good' stocks but one of the best and easiest is to use filters on our watchlists. This week we look at how we can find good quality cup-with-handle charts with a high expected gain if the stock breaks out in less than two minutes and go on to quickly review the charts using the ChartBrowser. Even if you are not a subscriber, read on because at the end we'll show you some top charts from our 11/23 watchlist.
Before we begin, lets review a few of our key metrics that we are going to filter on:
Right Cup Quality (RCQ) is a measure of the relative strength of accumulation to distribution days as the stock traverses the right side of the cup. The metric is constructed so that more recent days are weighted more heavily. Positive values are desirable and values over 1 indicate relatively heavy accumulation by the big market players who have the power to move the stock price significantly.
Handle Quality (HQ) is a measure of the price and volume activity in the handle. We expect to see some profit taking immediately after the pivot and then to see the volume fall to below average as the number of sellers, and therefore supply, diminishes. Handle Quality values greater than zero indicate this kind of pattern is established. A desirable feature of the handle not captured by our metric is that we like to see a support point established so that if we buy the stock on an attempted breakout1, we have an idea of what our downside risk is. Handles with very low or no levels of support imply greater risk if the breakout fails. We have to use our eyes to determine if support in the handle is present.
Chart Quality (CQ) is the sum of RCQ and HQ. CQ expresses the strength of the most recent chart action likely to determine performance after a breakout. There are other qualities of a good CwH chart that are not measured by this metric, however, and for which we also need to use our eyes. For example, we want to see a reasonably symmetric base pattern with lots of time to shake out the weak holders from the previous (left cup) high.
Expected Gain (EG) is the gain that we can expect over the coming several months if the stock breaks out. Our expected gain model (which is explained on our site) has a standard error of 39%. In other words, there is a 68% chance that the actual gain achieved will be in the range EG + or - 39%. It follows then that there is a 95% chance that the actual gain will be in the range EG + or - 78%. In other words, if we look for EG values greater than 78% then we have a 95% chance that the actual gain will be greater than zero. That doesn't mean that lower values of EG should be ignored, because statistically, they can perform very well also.
OK, now lets cut to the chase.
- Navigate to the latest CwH watchlist by choosing Mine For Candidates >
CwH BreakoutWatch

- Click the CwH tab to display the cup-with-handle criteria
- Clear any existing filters you have set and enter the values shown and
click the 'Apply ' button

- Click the Chart Quality column heading to sort in descending CQ order.
The results from November 23 are shown here:

- Now, to quickly review the charts themselves, click the ChartBrowser Button.
- To see the ChartBrowser in action, and for an analysis of each of the charts in our filtered list from 11/23, click the chart browser button that's circled above. Use the 'Next' and 'Previous' buttons to navigate the charts in the ChartBrowser.
We can't emphasize enough that this is only one way to find good stocks, and a somewhat restrictive one because of the high Expected Gain value that we set. There will be powerful breakouts by stocks in lower quality chart patterns and by stocks with much lower expected gains.
1 We issue email alerts when the intraday price reached the pivot point and the projected volume, on a straight line basis, is at least 1.5 times the average daily volume (adv). We call these 'attempted' breakouts and they become 'confirmed' at the end of the day if the price is maintained above the pivot and the actual volume was indeed at least 1.5 times adv.
If you received this newsletter from a friend and you would like to receive it regularly please go to the BreakoutWatch.com site and enter as a Guest.
Copyright © 2004 NBI charts, LLC da BreakoutWatch.com All rights reserved.