| Market Summary | Weekly Breakout Report | Top Breakout Choices | Top 2nd Chances | New Features | Tip of the Week |
The markets closed down again for the second week of 2005, although losses were not as dramatic as last week.The NASDAQ suffered least with a loss of just 0.03%, while the DJI and S&P 500 lost 0.43% and 0.14% respectively. The markets hit their recent nadir on Wednesday before rallying to record an accumulation day at the close. This positive development was followed by two more hopeful signs: on Thursday a sell-off failed to take out the support level established on Wednesday; and on Friday the markets closed near their highs of the day, the day before a three day weekend.
 Our
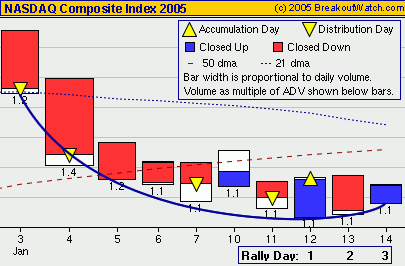
equivolume chart at right shows the pattern of trading since the start of the
year. After heavy volume in the first 3 days of the year, volume has
stabilized at just above average levels (although we show the trading as just
above average, remember that the average volume is artificially low because
of the recent light trading over the holiday period,
so this apparent above average trading is a little misleading) and may have
bottomed on Wednesday when the low for the year was set. The subsequent
higher
close
on Wednesday
means
we
count
Wednesday
as the
start
of a potential new rally. Our market model now looks for a follow-through day
before it will issue an 'enter' signal. For the NASDAQ, the model looks for
a close at least 1.5% higher than the previous close on the 4th through 10th
day of the rally. This could come as soon as the first day of trading next
week, which is Tuesday.
Healthcare-HMO continued to be the top industry in our rankings for the 6th week, while Retail - Major Discount Chains made the biggest improvement. Some of you have asked why our rankings diverge from IBD's and we will discuss the reasons for this in next week's newsletter. This will coincide with the introduction of an enhanced Industry Analysis service planned for next weekend, also.
This week saw more successful breakout attempts than last week, although with the market in an overall down trend it is inevitable that there will be fewer breakout attempts than average. There are two reasons for this: firstly, stocks are now low in their handles and so have to rise further to reach their pivot points, and secondly, there is a scarcity of buyers to drive up demand. The best performers were GLBC which closed the week for a 10.14% gain above its pivot after rocketing to a 24.8% intraday gain on Thursday (see our Top Tip below) and TIE which closed for a 6.3% gain.
New Server coming on Line Tuesday
We are transferring our site to a new server this weekend to cope with increased demand. This should come on line on Tuesday.
| Index | Value | Change Week | Change YTD | Market1 Signal |
||||||||||||||||||||||||||||||||
|---|---|---|---|---|---|---|---|---|---|---|---|---|---|---|---|---|---|---|---|---|---|---|---|---|---|---|---|---|---|---|---|---|---|---|---|---|
| Dow | 10558 | -0.43% | -2.09% | enter | ||||||||||||||||||||||||||||||||
| NASDAQ | 2087.91 | -0.03% | -4.02% | exit | ||||||||||||||||||||||||||||||||
| S&P 500 | 1184.52 | -0.14% | -2.26% | enter | ||||||||||||||||||||||||||||||||
1The Market Signal is derived from our proprietary
market model. The market model is described on the site. |
||||||||||||||||||||||||||||||||||||
# of Breakouts
|
Period Average1
|
Max. Gain During Period2
|
Gain at Period Close3
|
|
|---|---|---|---|---|
| This Week | 17 | 29.38 | 5.1% | 0.53% |
| Last Week | 9 | 30.08 | 7.36% | 3.36% |
| 13 Weeks | 384 | N/A | 17.55% |
5.04% |
Sector
|
Industry
|
Breakout Count for Week
|
|---|---|---|
Building
|
Building-Residentl/Comml
|
1
|
Building
|
Building-Maint & Services
|
1
|
Electronics
|
Electr-Semicndtr Mfg
|
1
|
Electronics
|
Electr-Scientific Instruments
|
1
|
Healthcare
|
Healthcare-Biomed/Genetic
|
1
|
Insurance
|
Insurance-Acc/Health
|
1
|
Insurance
|
Insurance-Brokers
|
1
|
Leisure
|
Leisure-Gaming
|
1
|
Oil & Gas
|
Oil & Gas-Mach/Equip
|
1
|
Real Estate/ REIT
|
Real Estate-REIT
|
1
|
Retail
|
Retail-Misc/Diversified
|
1
|
Retail
|
Retail-Auto Parts
|
1
|
Special
|
Special-ClsdEndFunds/Bond
|
1
|
Special
|
Special-Market/Tracking Funds
|
1
|
Steel
|
Steel -Specialty
|
1
|
Telecomm
|
Telecomm-FiberOptics
|
1
|
2This represents the return if each stock were bought at its breakout price and sold at its intraday high.
3This represents the return if each stock were bought at its breakout price and sold at the most recent close.
Category |
Symbol |
Company Name |
Expected Gain1 |
|---|---|---|---|
| Best Overall | RBAK | Redback Networks Inc. | 97 |
| Top Technical | BUCA | BUCA, Inc. | 62 |
| Top Fundamental | SRX | SRA International, Inc | 7 |
| Top Tech. & Fund. | AVID | Avid Technology, Inc. | 17 |
Category |
Symbol |
Company Name |
Expected Gain1 |
|---|---|---|---|
| Best Overall | FLSH | M-Systems Flash Disk Pioneers Ltd. | 54 |
| Top Technical | SIZ | Sizeler Property Investors, Inc. | 37 |
| Top Fundamental | HLEX | HealthExtras, Inc. | 41 |
| Top Tech. & Fund. | HLEX | HealthExtras, Inc. | 41 |
There were no new features added this week.
We did correct two bugs:
- Since the release of Windows XP SP2 some subscribers have been unable to access the links inside the BaseWatch and Database Search screens. A rewrite of these displays has resolved this issue.
- Due to the proliferation of ad, pop-up and spyware blockers, the menus did not work in some circumstances. A new 'standard' menu was introduced to hopefully work around these tools and a Menu Style choice was added to the menu so you can choose the menu style you like best.
Help with Searching for Shorting Candidates
A number of subscribers have asked if there is a way to use breakoutwatch.com to identify shorting candidates. We had to answer that although we could come up with a few ideas, they wouldn't meet the high standards set for the site. We do think it is very desirable to offer our subscribers a shorting watchlist in this unpredictable market, so we are giving top priority to adapting our chart pattern recognition tools to achieve this. Stay tuned for further news.
One subscriber saw the behavior of GLBC on Thursday, which made an intraday gain of 24.8% above the pivot before closing for a gain of 10.41% offering a potential short play gain of 14%, and asked "is it a good idea to short breakouts and cover them before the close". Given that it seems that many breakouts pull back from their intraday high before the close, on the face of it, this may seem like a good idea but there are a number of problems with this approach.
Firstly, how do you know when the intraday high has been reached? Secondly, assuming you are able to pick the high approximately, would your expected gain if you covered the position at the market close justify the risks involved with short selling. The following table analyses 3255 breakouts and shows that in nearly 92% of cases, the pullback is less than 5%.:
Analysis of Intraday Pullbacks on Breakout Attempt |
||
Intraday Pullback % |
No. of Breakouts |
% of Breakout Attempts |
|---|---|---|
>25 |
1 |
0.03 |
>20 |
2 |
0.06 |
>15 |
4 |
0.12 |
>10 |
41 |
1.26 |
>5 |
217 |
6.67 |
0 - 5 |
2990 |
91.86 |
Total |
3255 |
100 |
The fundamental problem is that breakouts are, by definition, strong stocks, so attempting to short them is like standing in front of an express train - you've got to jump quickly to get out of the way or be killed.
Where did that stock go?
 One
of the most common questions we get is "Why did stock XXXX disappear from the
list?".
Usually there is a simple explanation, but its often hard for a subscriber not intimately acquainted with the details of our watchlist criteria to understand why without asking the question.
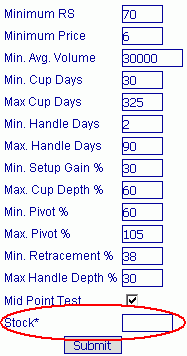
There is an easy way for you to find out why however, provided it was a cup-with-handle stock and you notice the stock has disappeared on the day after it last appeared. Just go to the Mine for Candidates > Chart Selector page and enter the stock ticker in the Stock field as shown at the right. Leave all the other parameters unchanged, because those are the same as used by our cup-with-handle algorithm and click the submit symbol. The algorithm will step through its various stages and tell you why the stock did not meet the criteria for the watchlist.
One of the most common reasons for a stock to disappear from a watchlist is that it set a new pivot point and must now form a new handle before it reappears. If a stock did set a new pivot on less than 150% of average daily volume, then its possible that an alert was never issued and so the explanation for its disappearance is not immediately obvious. In this case, the Chart Selector will tell you that the stock does not have a valid pivot point, because the handle is not yet at least 2 days long.
The stock has not disappeared from view completely, however. It will still be listed on the BaseWatch list, which contains all stocks forming a cup-like base which do not qualify for the cup-with-handle or double-bottom watchlist.
If you received this newletter from a friend and you would like to receive it regularly please go to the BreakoutWatch.com site and enter as a Guest. You will then be able to register to receive the newsletter.
Copyright © 2005 NBIcharts, LLC dba BreakoutWatch.com. All rights reserved.