| Market Summary | Weekly Breakout Report | Top Breakout Choices | Top 2nd Chances | New Features | Tip of the Week |
This was a very positive week for the markets in several respects. All indexes closed up by at least 2.5%, volume was above average, buying accelerated towards the close on Friday and most importantly, our market model issued an entry signal for the NASDAQ on Wednesday. We initially took this signal as being tentative as it was issued on a day when the NASDAQ rose only 0.3% and volume was not particularly strong. This reservation seemed justified on Thursday when the index erased its gains of the previous 2 sessions. But on Friday, the markets interpreted the economic signals for the week as indicating that the economy is growing steadily at a sustainable rate with little fear of wage-push inflation, and finished strongly. Fears of the potential damage that could be wrought by the trade deficit, the budget deficit, the falling dollar and oil prices seem to have receded for the present.
The NASDAQ is now just 1% away from its 50 day moving average at 2108. As we saw in last weeks newsletter, this could represent a hurdle. If it clears that bar, then the next point of resistance will be the high for 2004 set on December 31 and so we could expect a near term target of another 4%.
As could be expected in this rising market, the number of successful breakouts this week rose from 31 last week to 48 this week. The shooting star of the week was DHC which broke out of a nicely formed handle on Tuesday to close with a gain over its pivot of 50.5% after peaking at a gain of 61%. We'll take a closer look at this stock in our TopTip this week which deals with improving the risk/reward ratio when assessing breakout alerts.
The Healthcare sector again produced the most breakouts this week with a total of 5. Followers of our site will know that Healthcare has been our top ranked industry for several weeks.
The site suffered a hard drive failure on Tuesday and the site was taken down for reconstruction after the market closed. It was back later that evening although alerts were affected for the following day. As is our customary policy when major service interruptions occur, all subscribers were credited with an extra day to compensate for any loss of service.
| Index | Value | Change Week | Change YTD | Market1 Signal |
||||||||||||||||||||||||||||||||||||
|---|---|---|---|---|---|---|---|---|---|---|---|---|---|---|---|---|---|---|---|---|---|---|---|---|---|---|---|---|---|---|---|---|---|---|---|---|---|---|---|---|
| Dow | 10716.1 | 2.77% | -0.62% | enter | ||||||||||||||||||||||||||||||||||||
| NASDAQ | 2086.66 | 2.5% | -4.08% | enter | ||||||||||||||||||||||||||||||||||||
| S&P 500 | 1203.03 | 2.7% | -0.73% | enter | ||||||||||||||||||||||||||||||||||||
1The Market Signal is derived from our proprietary
market model. The market model is described on the site. 2The site also shows industry rankings based on fundamentals, combined technical and fundamentals, and on price alone (similar to IBD). The site also shows daily industry movements. |
||||||||||||||||||||||||||||||||||||||||
# of Breakouts
|
Period Average1
|
Max. Gain During Period2
|
Gain at Period Close3
|
|
|---|---|---|---|---|
| This Week | 48 | 25.77 | 4.83% | 3% |
| Last Week | 31 | 25.77 | 9.57% | 6.61% |
| 13 Weeks | 339 | N/A | 15.27% |
6.18% |
Sector
|
Industry
|
Breakout Count for Week
|
|---|---|---|
Oil & Gas
|
Oil & Gas-U S Explr/Prod
|
3
|
Business Services
|
Business Svcs-Misc
|
2
|
Chemical
|
Chemical-Basic
|
2
|
Computer Software
|
Comp Software-Enterprise
|
2
|
Food
|
Food-Meat Products
|
2
|
Insurance
|
Insurance-Prop/Casualty/TItl
|
2
|
Leisure
|
Leisure-Gaming
|
2
|
Special
|
Special-ClsdEndFunds/Bond
|
2
|
Auto & Truck
|
Auto & Truck-OEM
|
1
|
Banks
|
Banks-Foreign
|
1
|
Beverages
|
Beverages-Soft Drink
|
1
|
Building
|
Building-Products/Misc
|
1
|
Business Services
|
Business Svcs-Advertising
|
1
|
Computer
|
Computer-Peripheral Equip
|
1
|
Computer
|
Computer-Storage Devices
|
1
|
Computer Software
|
Comp Software-Financial
|
1
|
Electronics
|
Electr-Equipment
|
1
|
Electronics
|
Electr-Semicndtr Mfg
|
1
|
Electronics
|
Electr-Scientific Instruments
|
1
|
Finance
|
Finance-Mortgage Services
|
1
|
Healthcare
|
Healthcare-Biomed/Genetic
|
1
|
Healthcare
|
Healthcare-Med/Dent Supply
|
1
|
Healthcare
|
Healthcare-Instruments
|
1
|
Healthcare
|
Healthcare-Hospitals
|
1
|
Healthcare
|
Healthcare-Products
|
1
|
Leisure
|
Leisure-Movies & Related
|
1
|
Media
|
Media-Newspapers
|
1
|
Mining
|
Mining-Gold/Silver/Gems
|
1
|
Oil & Gas
|
Oil & Gas-Cdn Expl/Prd
|
1
|
Real Estate/ REIT
|
Real Estate Management
|
1
|
Retail
|
Retail-Restaurant
|
1
|
Retail
|
Retail-Apparel
|
1
|
Special
|
Special-Market/Tracking Funds
|
1
|
Telecomm
|
Telecomm-Equipment
|
1
|
Telecomm
|
Telecomm-Wireless Services
|
1
|
Telecomm
|
Telecomm-Services Fgn
|
1
|
Transportation
|
Transportation -Airlines
|
1
|
Utility
|
Utility-Electric
|
1
|
2This represents the return if each stock were bought at its breakout price and sold at its intraday high.
3This represents the return if each stock were bought at its breakout price and sold at the most recent close.
Category |
Symbol |
Company Name |
Expected Gain1 |
|---|---|---|---|
| Best Overall | GILTF | Gilat Satellite Networks Ltd. | 98 |
| Top Technical | NTMD | NitroMed, Inc. | 16 |
| Top Fundamental | CLFC | Center Financial Corporation | 17 |
| Top Tech. & Fund. | CLFC | Center Financial Corporation | 17 |
Category |
Symbol |
Company Name |
Expected Gain1 |
|---|---|---|---|
| Best Overall | MAPX | MAPICS Inc. | 60 |
| Top Technical | CTMI | CTI Molecular Imaging, Inc. | 39 |
| Top Fundamental | AVID | Avid Technology, Inc. | 0 |
| Top Tech. & Fund. | AVID | Avid Technology, Inc. | 0 |
The new Industry Analysis service continues in beta test status. A number of issues remain outstanding, particularly in relation to the price analysis. The hardware problems this week prevented us from resolving these issues as we had hoped. We certainly hope to be able to pronounce this service fully operational by next weekend.
Improving the Risk/Reward Ratio when assessing breakouts.
Each day, as our breakout alerts hit our inbox, we are faced with a decision as to whether or not to act on the alert. Hopefully, you will have already done your due diligence on stocks on our watchlists and already have a list of those that you will act on. This will allow you to act quickly and buy close to the pivot.You may also have set a filter so you will only receive alerts on stocks that meet your minimum investment criteria. One of the criteria you should consider is the risk/reward ratio of any investment. Managing your risk is necessary to control your drawdawn, minimizing your draw down is critical to staying in the game. This week we will look at how to assess the risk to reward ratio from our charts and watchlist statistics.
To assess the risk/reward ratio, we obviously need to know two things: firstly what's the downside, also know as the drawdown, if our investment turns out wrong, and secondly, what's our realistic potential gain.
First of all, lets look at the risk for a typical cup-with-handle chart.
Measuring Risk
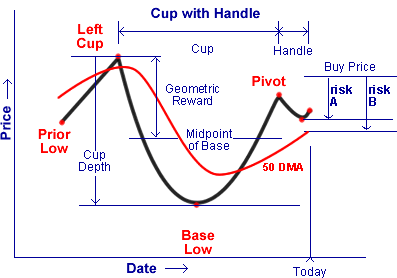
 The
chart at the right shows a stylized cup-with-handle chart representing a fairly
typical situation in which the handle forms above the 50 day moving average
line. Let's assume that an alert is received and on checking the current price
we find it is above the pivot price. We now want to know what our risk is.
Our risk is the difference between the buy price and the support level for
the stock. Theoretically, the pivot price, which was resistance, has now become
support, so that defines our minimum risk. Usually, however, we want to be
more cautious so we will asses our first realistic support level as the lowest
price
in
the handle. This gives us a first
level
of risk
shown
by
the
line
A in the
chart.
Depending on our tolerance to risk we may want to be more cautious and look
for the next level of support, which in our stylized example is the 50 day
moving average line. So our more cautious level of risk is shown by line B.
Sometimes the 50 dma passes through the handle and in that case the first level
of support is the 50 dma level and the next level is the handle low. We will
see a real life example of that later.
The first level of risk, shown by A, is found by looking at the handle depth statistic on our CwH watchlist. The second level of risk must be determined by looking at a chart, which is directly accessible by clicking the CwH link in the emailed alert.
Measuring Reward
Now we have measured our risk, we want to know our reward. There are several methods for doing this but I will discuss just two. Others include Fibonacci Ratios and Gann Analysis.
Breakoutwatch.com has developed a model that measures the expected gain (EG) if a stock breaks out. This model is based on technical and fundamental information known about the stock at the time of breakout and was discussed in our newsletter of 10/31/04. The expected gain is published on our site and is also included in each alert we send for a cup-with-handle breakout. This provides our first estimate of our expected reward. Because the expected gain may take some time to be realized (up to 180 days), I recommend using a percentage of the expected gain, lets say 50%, as the reward estimate.
Bukowski has also proposed a formula in his Encyclopedia of Chart Patterns whereby the expected reward will be 50% of the cup depth. I call that the geometric reward, because it is based purely on the geometry of the chart pattern. You can see it shown on the chart as the distance between the left cup high and the mid-point of the base.. You could use the geometric reward or 50 % of our EG figure ( to be very conservative) as a reasonable reward estimate.
To buy or not to buy, that is the question
The usual recommendation made in the literature is that the risk to reward ratio must be in the ratio of 1:3. A commonly recommended stop-loss is 7-8% which is a money management rule not related to the specific stock under consideration, or risk/reward ratio. If the risk was more than 7%, then under his guideline, you may choose to eliminate the stock from consideration unless the reward is at least 22%.
An Example: DHC
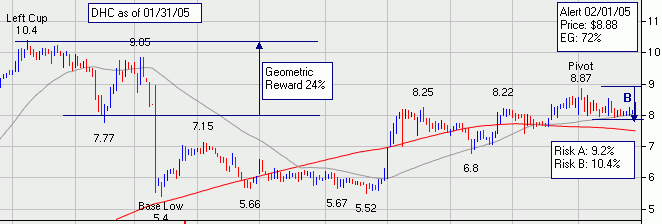
This chart shows DHC as it was on 01/31/02 just prior to breakout on 02/01/05. An alert was issued at a price of $8.88 (already 11c above the pivot) and an expected gain, EG, of 72%.
In this case the 50 day moving average passed through the handle, so that provided the first level of support (A) and a risk of 9.2%. The second level of support was the handle low at 10.4% below the alert price (B). The geometric reward was 24% and the conservative EG reward 36%. Based on the geometric reward, this was not a buy, but based on the conservative EG reward it was a buy with a reward to risk ratio of 3.5:1. On looking more closely at the chart, however, we can note how closely this stock (or more precisely the players in this stock) used the 50 day moving average as a support level. On this basis we could have reasonable confidence that support would be at the 50 dma level limiting our risk to 9.2% and making our reward to risk ratio a more interesting 4:1.
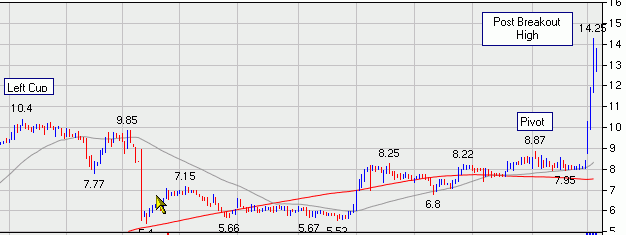
In fact, the stock went on to gain close to the expected gain of 72% in just four days, peaking at a gain of 60.1% and closing the week for a gain of 50 5%.
If you received this newletter from a friend and you would like to receive it regularly please go to the BreakoutWatch.com site and enter as a Guest. You will then be able to register to receive the newsletter.
Copyright © 2005 NBIcharts, LLC dba BreakoutWatch.com. All rights reserved.

