| Market Summary | Weekly Breakout Report | Top Breakout Choices | Top 2nd Chances | New Features | Tip of the Week |
This was a relatively good week for blue chips and the DJI closed in positive territory for the year for the first time. The S&P 500 and the NASDAQ are still lagging with the NASDAQ actually losing ground for the week.This was disappointing after the strong finish of last week. However, the week ended strongly once again with the NADAQ making its best one day gain of the year on Friday, but with volume only slightly above average, this did not represent strong institutional re-entry into that market.
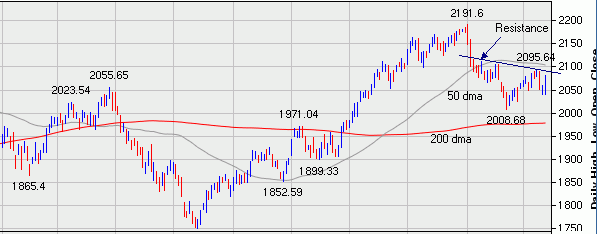
We have been discussing the resistance levels that the NASDAQ faces over the last couple of weeks. The resistance line is trending downwards and we still see the 50 day moving average as a barrier to progress. We would like to see a strong breakthrough of that level before feeling confident that the NASDAQ correction is over.
The number of breakouts fell this week. Breakouts are an indicator of the pulse and temperature of the markets and the decline this week confirms that the broader markets are ailing. The best performer of the week was USNA which gained 12.25% over its pivot. It had reached a top gain of 14.5% but was hurt by profit taking on Friday.
Industry sectors producing the most breakouts were Textiles, Electronics and Oil & Gas with three breakouts each. Oil & Gas-Drilling moved to the top of our industry ranks on a technical basis and the Oil & Gas sector is well represented in the top 20 industries.
Our top tip this week looks at how to use the industry analysis tools to find stocks offering suitable entry points in improving industries.
| Index | Value | Change Week | Change YTD | Market1 Signal |
||||||||||||||||||||||||||||||||||||
|---|---|---|---|---|---|---|---|---|---|---|---|---|---|---|---|---|---|---|---|---|---|---|---|---|---|---|---|---|---|---|---|---|---|---|---|---|---|---|---|---|
| Dow | 10796 | 0.75% | 0.12% | enter | ||||||||||||||||||||||||||||||||||||
| NASDAQ | 2076.66 | -0.48% | -4.54% | enter | ||||||||||||||||||||||||||||||||||||
| S&P 500 | 1205.3 | 0.19% | -0.55% | enter | ||||||||||||||||||||||||||||||||||||
1The Market Signal is derived from our proprietary
market model. The market model is described on the site. 2The site also shows industry rankings based on fundamentals, combined technical and fundamentals, and on price alone (similar to IBD). The site also shows daily industry movements. |
||||||||||||||||||||||||||||||||||||||||
# of Breakouts
|
Period Average1
|
Max. Gain During Period2
|
Gain at Period Close3
|
|
|---|---|---|---|---|
| This Week | 30 | 24.46 | 5.29% | 3.08% |
| Last Week | 48 | 25.77 | 8.06% | 3.53% |
| 13 Weeks | 323 | N/A | 14.13% |
3.98% |
Sector
|
Industry
|
Breakout Count for Week
|
|---|---|---|
Textile
|
Textile-Apparel Mfg
|
3
|
Leisure
|
Leisure-Gaming
|
2
|
Personal
|
Personal -Cosmetics
|
2
|
Aerospace & Defense
|
Aerospace & Defense-Electr
|
1
|
Building
|
Building-Products/Misc
|
1
|
Computer
|
Computer-Networking
|
1
|
Computer
|
Computer-Makers
|
1
|
Containers
|
Containers
|
1
|
Electronics
|
Electr-Semicndtr Equip
|
1
|
Electronics
|
Electr-Semicndtr Mfg
|
1
|
Electronics
|
Electr-Connectors/Components
|
1
|
Finance
|
Finance-Savings&Loan
|
1
|
Finance
|
Finance-Invest Management
|
1
|
Healthcare
|
Healthcare-Products
|
1
|
Insurance
|
Insurance-Prop/Casualty/TItl
|
1
|
Metal Prds
|
Metal Prds-Pipe/Fab/Misc
|
1
|
Mining
|
Mining-Gold/Silver/Gems
|
1
|
Mining
|
Mining-Misc Ores
|
1
|
Oil & Gas
|
Oil & Gas-Refining/Mktg
|
1
|
Oil & Gas
|
Oil & Gas-Mach/Equip
|
1
|
Oil & Gas
|
Oil & Gas-Intl Explr/Prod
|
1
|
Special
|
Special-Market/Tracking Funds
|
1
|
Special
|
Special-ClsdEndFunds/Bond
|
1
|
Telecomm
|
Telecomm-Wireless Services
|
1
|
Transportation
|
Transportation -Airlines
|
1
|
2This represents the return if each stock were bought at its breakout price and sold at its intraday high.
3This represents the return if each stock were bought at its breakout price and sold at the most recent close.
Category |
Symbol |
Company Name |
Expected Gain1 |
|---|---|---|---|
| Best Overall | GILTF | Gilat Satellite Networks Ltd. | 109 |
| Top Technical | NTMD | NitroMed, Inc. | 23 |
| Top Fundamental | CLFC | Center Financial Corporation | 22 |
| Top Tech. & Fund. | STST | ARGON ST, Inc. | 19 |
Category |
Symbol |
Company Name |
Expected Gain1 |
|---|---|---|---|
| Best Overall | WLDA | World Air Holdings, Inc. | 55 |
| Top Technical | WLDA | World Air Holdings, Inc. | 55 |
| Top Fundamental | CRI | Carter's, Inc. | 3 |
| Top Tech. & Fund. | FLSH | M-Systems Flash Disk Pioneers Ltd. | 39 |
The new Industry Analysis service continues in beta test status. We are still reviewing our assignment of stocks to industries and hope to complete that in the coming week.
A 'list' column was added to the Industry List (list of stocks in each industry) so you can more easily find stocks that are offering suitable entry points from the industry analysis tools.
Using Industry Analysis to find improving industries and stocks offering a current entry point
We are almost ready to finalize our new Industry Analysis tool and take it out of beta test, so this week we will look at how to use it to find improving industries and stocks within those industries that offer suitable entry points.
NB: This tutorial was prepared based on data as of the market close on Thursday, 02/10/05, and may not represent what you will see when you read this.
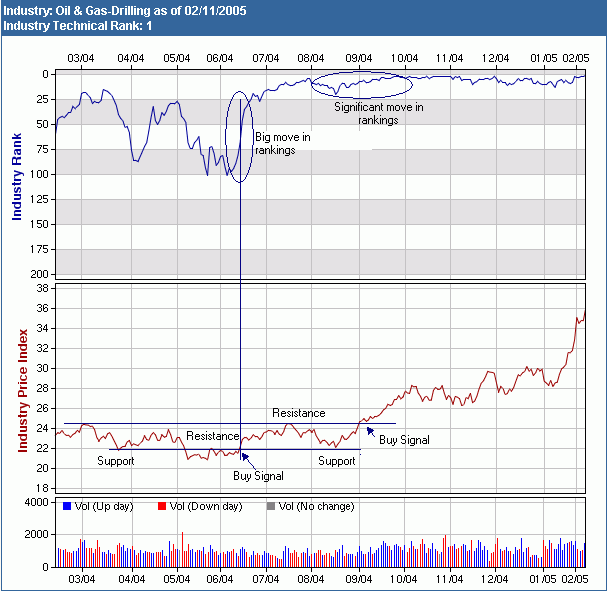
Firstly, lets look at the chart of our top ranked industry on a technical basis, Oil & Gas Drilling. We see that it has been relatively high in our rankings since September of last year. Since achieving a high ranking then, it went on to gain 50% in value confirming the adage that one should buy the top performing stocks in the top performing industries. Looking at the price chart (derived from the average price of stocks in the industry) and the rankings chart we can see that there were two signals that this industry was improving and was ready to buy. These were when the industry broke through support in June and then again at the beginning of September. Because these buy signals were accompanied by a significant change in industry rank, we can use the change in rank columns on our industry analysis to find industries that are improving.
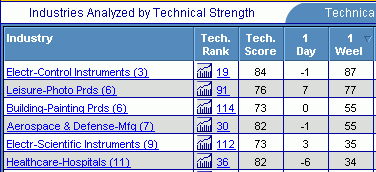 We do this by sorting the change in rank columns so we bring the industries
with the biggest change in rank to the top. If we do this on the one week
change column in the current list we get a new list with the stocks
at the top shown on the right.
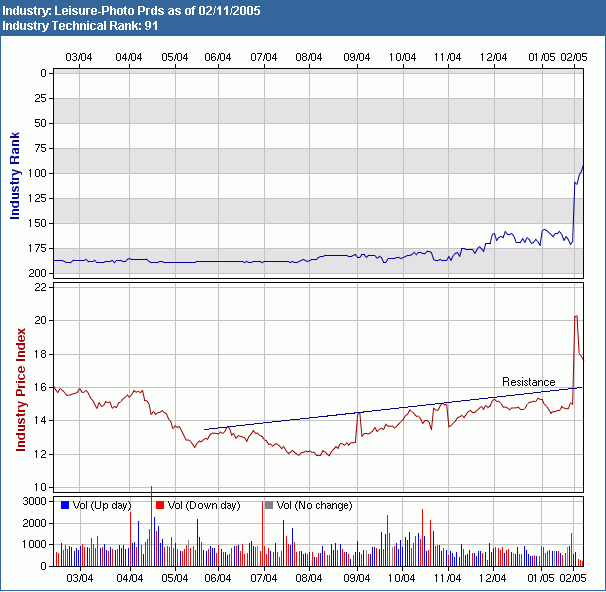
We now look at the charts of these industries looking for entry signals. The second on the list is Leisure-Photo Products whose chart shows that a resistance line was recently breached.
Now we have found an industry making a significant move, we would like to know if there are any stocks in the industry offering a suitable entry point. Clicking the industry name in our Industry Analysis list will bring up the list of stocks in the industry. If any of the stocks are on our current watchlists, that will be indicated in the 'list' column (new feature this week). For Leisure-Photo Products, the list shows that Eastman Kodak is currently in a cup-with-handle formation. Clicking the symbol will display an annotated chart.
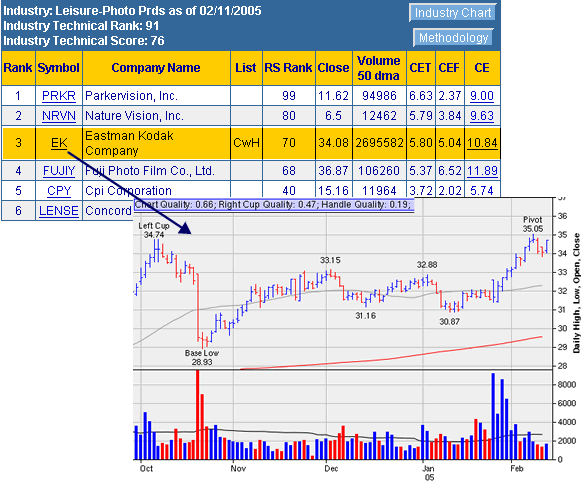
Should EK break out, then the improving relative strength of the Leisure-Photo Products industry may carry it to new highs.
Disclaimer: We are not recommending EK as a suitable investment. We are showing how to use a combination of our industry analysis tools, watchlists and charts to find stocks that may offer suitable investment opportunities.
If you received this newletter from a friend and you would like to receive it regularly please go to the BreakoutWatch.com site and enter as a Guest. You will then be able to register to receive the newsletter.
Copyright © 2005 NBIcharts, LLC dba BreakoutWatch.com. All rights reserved.