| Market Summary | Weekly Breakout Report | Top Breakout Choices | Top 2nd Chances | New Features | Tip of the Week |
New Service: Breakdown Alerts - see this weeks Top Tip
The indexes closed the week on a high with the DJI setting its best level for the year while the S&P 500 just failed to better the high set on February 16. The NASDAQ closed at its high for the week, but is still well below its 50 day moving average which it touched and then retreated from on February 15.
The 'N' in CANTATA favors new stocks and for that reason the NASDAQ has been the market where we have expected the majority of CANTATA quality breakout stocks to come from. However, readers of this newsletter will have noted that we have been decidedly negative about the prospects for the NASDAQ for several weeks now. While the last three days have been more positive for that index, we still feel that until what has become the bugaboo of the 50 day moving average is beaten, then it will continue to struggle.
A glance at our Industry Analysis table based on technical condition quickly shows where the strength is, and so it is not surprising that the DJI and S&P 500 are substantially outperforming the NASDAQ. The top three sectors are oil and gas related, which is of course because of the ongoing rise in oil prices, and the 4th is Foreign Banks, which must be attractive in view of there being no floor in sight for the dollar.
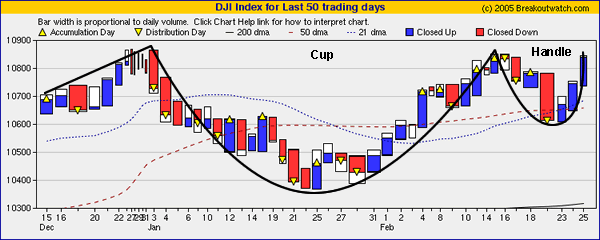
To see where the next strong breakouts will come from, lets look at our equivolume chart of the DJI. It shows a classic cup-with-handle shape. While a CwH pattern for the index is not of great significance in itself, (because we don't buy the index, but instead buy the stocks within the index that are breaking out), it does show that the majority of the stocks making up the index must also be in a CwH pattern. If strong institutional buying were to occur we would expect the DJI stocks (and secondarily the S&P 500) to be the ones that would show the best returns. (Note: we don't follow the small cap indexes, although that is something we hope to add in the near future).

Since institutions must, for the most part, invest the funds they have on deposit, we would like to see retail investor confidence rise so that institutions have more funds to invest. This is the key to driving overall indexes higher, rather than sectoral rotation.
Although the number of successful breakouts was down to 24 this week, their overall performance was substantially better with an average gain for the week of 6.5% (more than 10 times the DJI). BOOM was the big bang of the week with not one but two breakouts. It broke out on Tuesday and then formed a new short handle before breaking out again on Friday for an overall gain of 31.6%. The poster child for the year remains DHC which has now gained 83.5% since its February 1 breakout.
| Index | Value | Change Week | Change YTD | Market1 Signal |
||||||||||||||||||||||||||||||||||||
|---|---|---|---|---|---|---|---|---|---|---|---|---|---|---|---|---|---|---|---|---|---|---|---|---|---|---|---|---|---|---|---|---|---|---|---|---|---|---|---|---|
| Dow | 10841.6 | 0.52% | 0.54% | enter | ||||||||||||||||||||||||||||||||||||
| NASDAQ | 2065.4 | 0.33% | -5.06% | enter | ||||||||||||||||||||||||||||||||||||
| S&P 500 | 1211.37 | 0.81% | -0.05% | enter | ||||||||||||||||||||||||||||||||||||
1The Market Signal is derived from our proprietary
market model. The market model is described on the site. 2The site also shows industry rankings based on fundamentals, combined technical and fundamentals, and on price alone (similar to IBD). The site also shows daily industry movements. |
||||||||||||||||||||||||||||||||||||||||
# of Breakouts
|
Period Average1
|
Max. Gain During Period2
|
Gain at Period Close3
|
|
|---|---|---|---|---|
| This Week | 24 | 23.77 | 8.57% | 6.49% |
| Last Week | 40 | 24.54 | 8.21% | 4.44% |
| 13 Weeks | 314 | N/A | 13.06% |
4.34% |
Sector
|
Industry
|
Breakout Count for Week
|
|---|---|---|
Business Services
|
Business Svcs-Misc
|
2
|
Electronics
|
Electr-Semicndtr Equip
|
2
|
Metal Prds
|
Metal Prds-Pipe/Fab/Misc
|
2
|
Textile
|
Textile-Apparel Mfg
|
2
|
Aerospace & Defense
|
Aerospace & Defense-Equip
|
1
|
Banks
|
Banks-Money Center
|
1
|
Diversified Operations
|
Diversified Operations
|
1
|
Electronics
|
Electr-Misc Products
|
1
|
Healthcare
|
Healthcare-Med/Dent Services
|
1
|
Healthcare
|
Healthcare-Outpnt/HmCare
|
1
|
Leisure
|
Leisure-Gaming
|
1
|
Mining
|
Mining-Gold/Silver/Gems
|
1
|
Oil & Gas
|
Oil & Gas-Field Services
|
1
|
Oil & Gas
|
Oil & Gas-Intl Explr/Prod
|
1
|
Personal
|
Personal -Cosmetics
|
1
|
Real Estate/ REIT
|
Real Estate-REIT
|
1
|
Retail
|
Retail-Department Stores
|
1
|
Steel
|
Steel -Producers
|
1
|
Utility
|
Utility-Electric
|
1
|
2This represents the return if each stock were bought at its breakout price and sold at its intraday high.
3This represents the return if each stock were bought at its breakout price and sold at the most recent close.
Category |
Symbol |
Company Name |
Expected Gain1 |
|---|---|---|---|
| Best Overall | MDSI | MDSI Mobile Data Solutions, Inc. | 105 |
| Top Technical | DCAI | Dialysis Corporation of America | 47 |
| Top Fundamental | AMHC | American Healthways, Inc. | 29 |
| Top Tech. & Fund. | DCAI | Dialysis Corporation of America | 47 |
Category |
Symbol |
Company Name |
Expected Gain1 |
|---|---|---|---|
| Best Overall | VIDE | Video Display Corporation | 58 |
| Top Technical | VIDE | Video Display Corporation | 58 |
| Top Fundamental | SHFL | Shuffle Master, Inc. | 21 |
| Top Tech. & Fund. | SHFL | Shuffle Master, Inc. | 21 |
ShortSale Selection Criteria Amendments
Based on feed back from subscribers, we have changed the way we filter for institutional investment and added a new criterion about the relationship of the most recent close to the 50 day moving average.
Former ShortsaleWatch
Criteria
|
New Criteria
|
|---|---|
1. The stock must be owned by at least
100 institutions or have closed at $15 or more.
|
1. At least 30% of the share float must be held by institutions. There is no minimum share price now. When institutions unload a stock, they can significantly increase supply which will drive down the price. The best shorting candidates will have a significant percentage of their share float held by institutions. |
8. The stock must have closed within 5% of its 50 dma. We want to exclude stocks that are too far above the 50 day moving average or are already too far below it to be probable shorting candidates. |
The full set of criteria is listed on the site.
Receiving Alerts on Breakdowns
Last week we introduced ShortsaleWatch, our new watchlist of stocks that may be suitable shorting candidates. This was enthusiastically received and we are now ready to start issuing alerts based on this watchlist. We are also introducing alerts on breakdowns from the Flat Base watchlist.
Breakdown alerts are available to Gold and Platinum subscribers and are an optional feature available at no additional charge. The alerts will be issued from each watchlist as described below and are based on real-time prices checked at one minute intervals.
ShortsaleWatch Breakdowns
A 'Breakdown Alert' will be issued during trading hours based on ShortsaleWatch when the following conditions are met:
- The stock is on the ShortsaleWatch watchlist produced from the previous day's trading
- The stock's price is below the previous day's close AND below the 50 dma level.
- The projected daily volume exceeds 1.5 times the average daily volume for the stock The projected daily volume is obtained by making a straight line projection to market close based on the actual volume at the time of the alert.
FlatbaseWatch Breakdowns
A 'Breakdown Alert' will be issued during trading hours based on FlatbaseWatch when the following conditions are met:
- The stock is on the FlatbaseWatch watchlist produced from the previous day's trading
- The stock's price is below the support price shown on FlatbaseWatch
- The projected daily volume exceeds 1.5 times the average daily volume for the stock The projected daily volume is obtained by making a straight line projection to market close based on the actual volume at the time of the alert.
When an alert is issued, it will also be listed on the site on the 'Alerts' page. There will also be a new report under the 'Monitor' menu called 'Recent Breakdowns' which will show breakdowns for the day and previous days in the same way the current Breakout Report does.
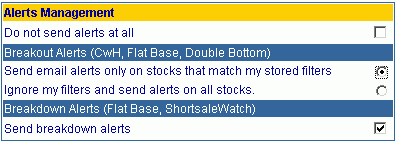
To modify your account to receive Breakdown Alerts, please login to the site and choose Account Management > Update Account.
Then check the Send breakdown alerts option as shown below.

If you received this newletter from a friend and you would like to receive it regularly please go to the BreakoutWatch.com site and enter as a Guest. You will then be able to register to receive the newsletter.
Copyright © 2005 NBIcharts, LLC dba BreakoutWatch.com. All rights reserved.