| Market Summary | Weekly Breakout Report | Top Breakout Choices | Top 2nd Chances | New Features | Tip of the Week |
Market Summary
The markets recovered from their lows of the year this week to close higher for the week. The DJI gained 0.7%, the NASDAQ Composite, 1.26% and the S&P 500, 0.83%. After a strong distribution day on Wednesday, the markets recovered on Thursday, but on lighter volume, and then succumbed to profit taking on Friday. The bright spot in Friday's trading was that the markets rallied strongly in the last 30 minutes to close above their lows of the day.
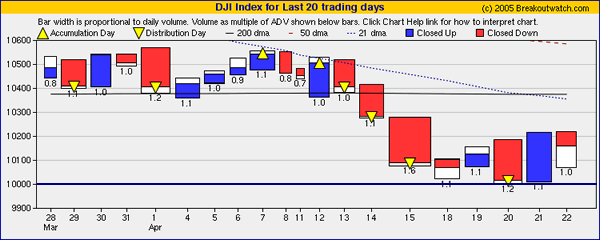
A glance at our equivolume chart of the DJI shows that this index is still under distribution. The width of the bars is proportional to the average daily volume and it is clear that the red bars are consistently wider than the blue ones. There have been 6 distribution days, but only 2 accumulation days in the last 20 sessions. The DJI tested the psychological 10,000 barrier on Wednesday and recovered from it. If there is a further test of 10,000 and the index does not find support at that level, then the next support level is 300 points lower at 9700.
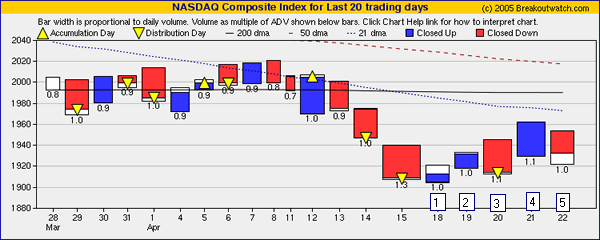
The NASDAQ Composite is of most interest to CANTATA investors as that is where the new leaders (the 'N' in CANTATA) usually appear from. The NASDAQ marked its low of the year on Monday but recovered to close higher on the day. That set the clock running for a confirmation of the rebound during the next 4 to 10 sessions using our market model which is described here. As you can see from the following chart, Wednesday's distribution day did not undercut Monday's low, so the clock kept running. Thursday was day 4 of the count but volume was lower than Wednesday so it did not count as an accumulation day. Consequently, despite the huge 2.5% gain, the model did not change from 'exit' to 'enter'. On Friday the clock continued to run as Monday's low was still not undercut.
Breakouts
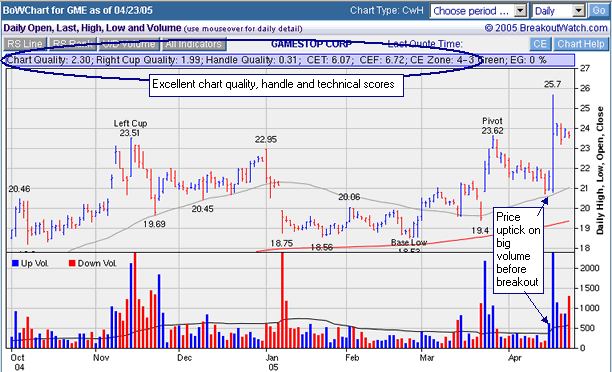
The number of confirmed breakouts fell again this week to 21, less than the 13 week average of 25.5. We also see that while breakouts are performing quite well for a few days, they are not maintaining their gains and slipping back to follow the overall market trend downwards. This suggests that a day-trading or swing-trading style is most profitable at the moment. Some examples of this from this week were ASPM that rose 8% above its pivot to fall back to a 2.5% gain, GME that gained 8.8% before slipping back to just 0.1% over its pivot and UTHR which gained 7.75% before slipping back to a 5.2% gain. ASPM and GME shared a common characteristic of stocks that make big breakouts, as shown in the chart of GME below. We discuss this in more detail in today's top tip.
Breakdowns
Despite Wednesday's big selloff, there were just 5 confirmed breakdowns this week. We issued a breakdown alert on PPC on Monday from ShortsaleWatch which fell 7.5% by week's end. The overall average loss of breakdowns since we started the alerts service on March 1, is 7.9%. Subscribers are reminded that to receive breakdown alerts, they need to request them on the Account Management > Update Account page.
Get a 14 day Trial of our premium 'Platinum' service for just $9.95 and if you subsequently subscribe to any subscription level we will credit your $9.95 to your subscription. 14
Day Platinum Trial |
| Index | Value | Change Week | Change YTD | Market1 Signal |
||||||||||||||||||||||||||||||||||||
|---|---|---|---|---|---|---|---|---|---|---|---|---|---|---|---|---|---|---|---|---|---|---|---|---|---|---|---|---|---|---|---|---|---|---|---|---|---|---|---|---|
| Dow | 10157.7 | 0.7% | -5.8% | enter | ||||||||||||||||||||||||||||||||||||
| NASDAQ | 1932.19 | 1.26% | -11.18% | exit | ||||||||||||||||||||||||||||||||||||
| S&P 500 | 1152.12 | 0.83% | -4.93% | enter | ||||||||||||||||||||||||||||||||||||
1The Market Signal is derived from our proprietary
market model. The market model is described on the site. 2The site also shows industry rankings based on fundamentals, combined technical and fundamentals, and on price alone (similar to IBD). The site also shows daily industry movements. |
||||||||||||||||||||||||||||||||||||||||
# of Breakouts
|
Period Average1
|
Max. Gain During Period2
|
Gain at Period Close3
|
|
|---|---|---|---|---|
| This Week | 21 | 24.54 | 3.73% | 0.29% |
| Last Week | 24 | 24.23 | 1.6% | -6.96% |
| 13 Weeks | 357 | 25.54 | 11.86% |
-3.11% |
Sector
|
Industry
|
Breakout Count for Week
|
|---|---|---|
Aerospace & Defense
|
Aerospace & Defense-Equip
|
2
|
Business Services
|
Business Svcs-Misc
|
2
|
Healthcare
|
Healthcare-Biomed/Genetic
|
2
|
Home
|
Home-Furniture
|
2
|
Banks
|
Banks-Northeast
|
1
|
Computer Software
|
Comp Software-Desktop
|
1
|
Diversified Operations
|
Diversified Operations
|
1
|
Electronics
|
Electr-Semicndtr Equip
|
1
|
Finance
|
Finance-Misc Services
|
1
|
Finance
|
Finance-Savings&Loan
|
1
|
Healthcare
|
Healthcare-Instruments
|
1
|
Leisure
|
Leisure-Products
|
1
|
Machinery
|
Machinery-Industrial
|
1
|
Oil & Gas
|
Oil & Gas-Field Services
|
1
|
Retail
|
Retail-Restaurant
|
1
|
Retail
|
Retail-Consumer Electr
|
1
|
Textile
|
Textile-Apparel Mfg
|
1
|
2This represents the return if each stock were bought at its breakout price and sold at its intraday high.
3This represents the return if each stock were bought at its breakout price and sold at the most recent close.
Category |
Symbol |
Company Name |
Expected Gain1 |
|---|---|---|---|
| Best Overall | TRAD | TRADESTATION GROUP INC | 50 |
| Top Technical | RIV | RIVIERA HLDGS CORP | 15 |
| Top Fundamental | BHBC | 19 | |
| Top Tech. & Fund. | RRGB | RED ROBIN GOURMET BURGERS IN | 2 |
Category |
Symbol |
Company Name |
Expected Gain1 |
|---|---|---|---|
| Best Overall | NR | NEWPARK RES INC | 25 |
| Top Technical | PRSC | PROVIDENCE SVC CORP | 1 |
| Top Fundamental | CW | CURTISS WRIGHT CORP | -15 |
| Top Tech. & Fund. | PRSC | PROVIDENCE SVC CORP | 1 |
A download facility was added to our Database Search service. This allows you to download the search results to Excel or any other software that accepts comma separated values (.csv) files.
Watch Handle Action for Signs of a Strong Breakout to Come
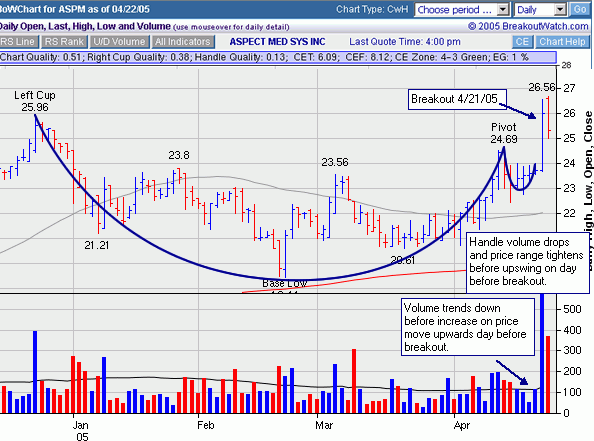
ASPM broke out of a cup-with-handle on Thursday, 4/21/05, on very strong volume and gained 8% over its pivot, (12% above its open) before it closed at 5.6% above the breakout price after profit taking. The price/volume action in the handle was typical of what we often see before a strong breakout as we also observed with GME this week (see above). Before we look at the chart of ASPM lets review the characteristics of a well formed handle.
- There should be a price pullback on moderately high volume after the pivot is set. This occurs because weak holders are taking profits.
- The pull back volume should be less than the volume on the day the pivot was set
- The volume should dry up as all weak holders close out their positions
- As the volume dries up, the daily trading range should tighten as the price stabilizes.
These characteristics are all measured by our Handle Quality (HQ) metric where values above zero are acceptable, with the higher the score, the better.
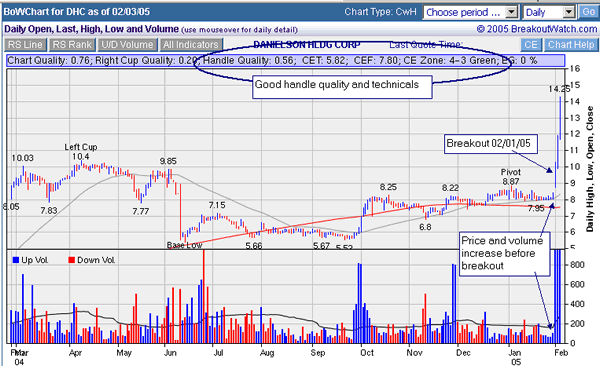
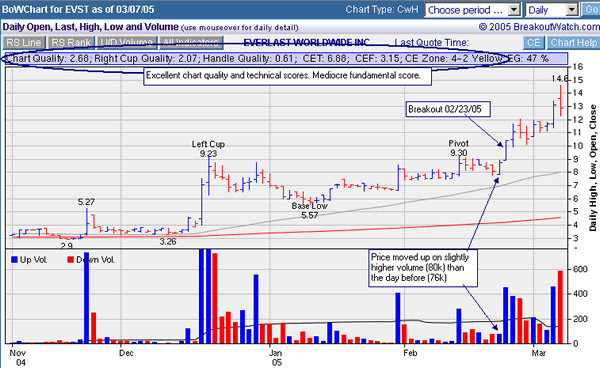
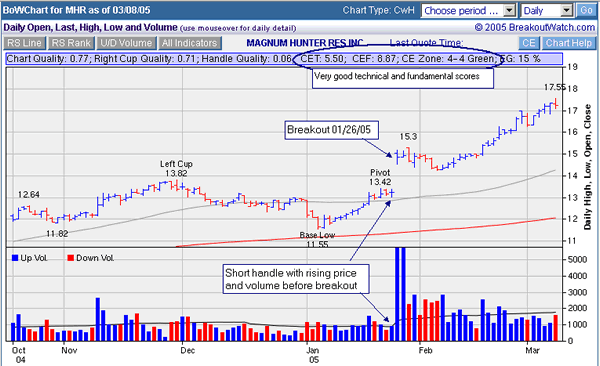
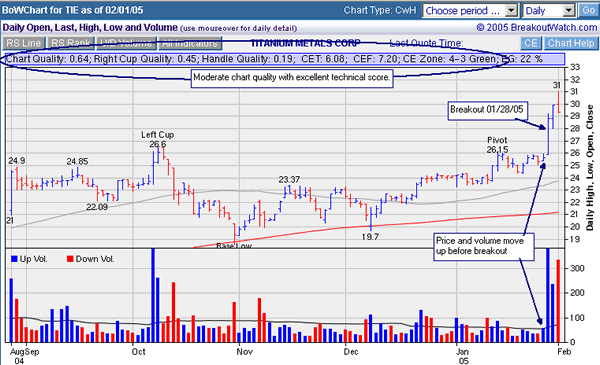
ASPM displays an additional characteristic that is frequently prevalent in strong breakouts but not measured in our HQ metric - the price rises on increased volume on the day before the breakout. An analysis of all breakouts since the start of the year shows that the average gain on breakout day when this condition is present is 17.3% higher than when the price does not rise on increased volume on the day before breakout. This is a very important result if you intend to trade breakouts in the short term, rather than hold for the medium term.
Here's the chart for ASPM:
There are many other examples I could show since the start of the year. There were 173 breakouts with a positive HQ score, of which 73 showed a price upturn on increased volume on the day before breakout. The average gain over their pivot on the breakout day for the 173 stocks was 2.77% while the average gain for the 73 was 3.25%, a 17.3% improvement.
Here are some examples of other high gainers on the breakout day.
DHC closed 15% above its pivot on 02/01/05 and went on to gain 60% in three days and 99% by April 6.
EVST closed 11.7% above its pivot on 2/23/05 and went on to gain 58% in 9 sessions.
MHR closed 10.7% above its pivot on 1/26/05 and went on to gain 30% on March 8.
TIE closed 10.4% above its pivot on 1/28/05 and went on to gain 54% on March 1.
Caution
A price upswing on increased volume in the handle does not mean that the stock will breakout in the next session.
Conclusion
A price upswing on increased volume is a signal that the breakout will be significantly stronger than average if the stock breaks out. You can find these stocks on our CwHWatch list by using the ChartBrowser and watching for a blue volume line on the current trading day.
Get a 14 day Trial of our premium 'Platinum' service for just $9.95 and if you subsequently subscribe to any subscription level we will credit your $9.95 to your subscription. 14
Day Platinum Trial |
If you received this newletter from a friend and you would like to receive it regularly please go to the BreakoutWatch.com site and enter as a Guest. You will then be able to register to receive the newsletter.
Copyright © 2005 NBIcharts, LLC dba BreakoutWatch.com. All rights reserved.