| Market Summary | Weekly Breakout Report | Top Breakout Choices | Top 2nd Chances | New Features | Tip of the Week |
Market Summary
The DJI and S&P 500 made modest gains this week while the NASDAQ gave a strong performance that caused our market model to change the signal to 'enter' for that market. The DJI closed 1.5% higher, the NASDAQ composite 2.38% higher and the S&P 500 gained 1.25%. Each of the major indexes is still down for the year so far, with the NASDAQ having the largest deficit at -9.6%.
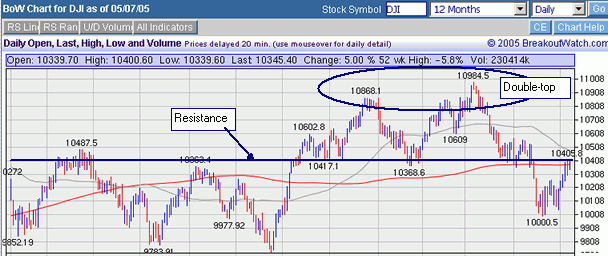
The DJI is testing a resistance level that is evident on the chart below at about 10400, which also happens to coincide with the psychological barrier of the 200 day moving average. It fell back from that level on both Thursday and Friiday. If the DJI pulls back further from this level then we will likely see a confirmation of the downtrend portended by the double-top of 12/27/04 and 03/07/05.

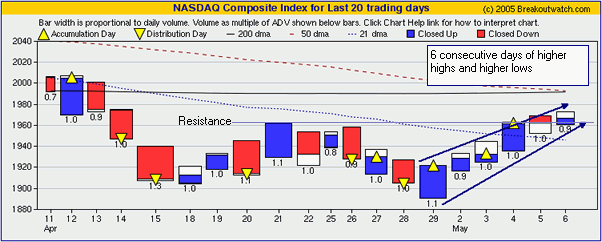
Since the NASDAQ is the incubator for new companies, this is market which is of most interest to CANTATA investors. The NASDAQ Composite provided a strong follow through on Wednesday when it gained 1.51% on the fourth day of the rally that began on April 29. The NASDAQ paused slightly on Thursday and then rose again on Friday. We have now seen six consecutive days of higher highs and higher lows for this index, which is a cause for cautious optimism that this index is now on the path to recovery.

Resistance at 1962 was penetrated briefly on Thursday and then the index closed 5 points above that level on Friday. If that level holds, then there is the psychological barrier of the 200 day moving average to overcome at around 1990. The next resistance level is at 2022 and after that 2100.
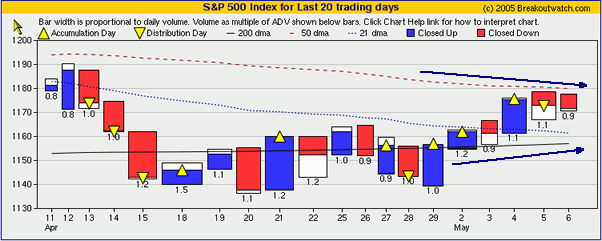
The S&P 500 is consolidating between its 200 and 50 day moving averages.

Breakouts
The number of successful breakouts was again 50% above the recent average at 35 with an average maximum gain of 5.3%. Some of the strongest performers were AQNT which closed the week 13.6% above its pivot, CCRT which gained 17.7% before slipping back for an 11.5% gain, and SWN which gained 10.6%. Five other stocks gained more than 5%. Each of these strong breakouts had moved up on higher volume on the day before breakout, a characteristic of strong breakouts that we drew attention to last week.
Breakdowns
On a week when the markets moved higher, there were just 5 confirmed breakdowns.
Details of all the breakouts and breakdowns are available on the site.
The change in market signal for the NASDAQ and the increasing number and strength of breakouts are indicators that the opportunities for making significant gains from breakouts are increasing. In this weeks top tip we look at how to take advantage of this situation.
Get a 14 day Trial of our premium 'Platinum' service for just $9.95 and if you subsequently subscribe to any subscription level we will credit your $9.95 to your subscription. 14
Day Platinum Trial |
New Home Page
There were no new features added this week.
Choosing Breakouts that will give the Best Returns
With a new rally gaining steam, there will be more breakouts to choose from. Since very few of us can buy all breakouts, its natural to want to know which ones will offer the best returns. There is no way of knowing for certain with any individual stock, of course, but we can identify the characteristics that improve the chances of success. Over the last 6 months I have written about those factors in this space, so today I will summarize the top half-dozen and provide links to the original article that described them.
1. Expected Gain is the best overall predictor of a stock's likely future performance after breakout from a cup-with-handle base. It is derived from all the technical and fundamental data we have on the stock on the day of the breakout.
2. Handle action can indicate a strong breakout. Stocks that move up on increased volume on the day before breakout have a 17% stronger breakout than others.
3. Technical condition is more important than fundamental strength when determining if a stock will breakout. Most breakouts come from zone 4-3 in our CANTATA Evaluator zone methodology.
4. Higher pivots are more successful. Over 80% of successful cup-with-handle breakouts come from pivot points that are at least 90% of the left cup height.
5. Returns can be improved by minimizing downside risk. Before buying a breakout, look at the likely support level if the breakout fails.
6. Improving your returns also involves minimizing losses. Use our Market Signals to decide when to raise cash.
Get a 14 day Trial of our premium 'Platinum' service for just $9.95 and if you subsequently subscribe to any subscription level we will credit your $9.95 to your subscription. 14
Day Platinum Trial |
| Index | Value | Change Week | Change YTD | Market1 Signal |
||||||||||||||||||||||||||||||||||||
|---|---|---|---|---|---|---|---|---|---|---|---|---|---|---|---|---|---|---|---|---|---|---|---|---|---|---|---|---|---|---|---|---|---|---|---|---|---|---|---|---|
| Dow | 10345.4 | 1.5% | -4.06% | enter | ||||||||||||||||||||||||||||||||||||
| NASDAQ | 1967.35 | 2.38% | -9.57% | enter | ||||||||||||||||||||||||||||||||||||
| S&P 500 | 1171.35 | 1.25% | -3.35% | enter | ||||||||||||||||||||||||||||||||||||
1The Market Signal is derived from our proprietary
market model. The market model is described on the site. 2The site also shows industry rankings based on fundamentals, combined technical and fundamentals, and on price alone (similar to IBD). The site also shows daily industry movements. |
||||||||||||||||||||||||||||||||||||||||
# of Breakouts
|
Period Average1
|
Max. Gain During Period2
|
Gain at Period Close3
|
|
|---|---|---|---|---|
| This Week | 35 | 23.15 | 5.31% | 2.97% |
| Last Week | 35 | 24.23 | 5.53% | 1.07% |
| 13 Weeks | 350 | 26.85 | 9.94% |
-1.64% |
Sector
|
Industry
|
Breakout Count for Week
|
|---|---|---|
Computer
|
Computer-Services
|
3
|
Healthcare
|
Healthcare-Biomed/Genetic
|
3
|
Finance
|
Finance-Consumer Loans
|
2
|
Healthcare
|
Healthcare-Products
|
2
|
Real Estate/ REIT
|
Real Estate-REIT
|
2
|
Aerospace & Defense
|
Aerospace & Defense-Mfg
|
1
|
Auto & Truck
|
Auto & Truck-Repl Prts
|
1
|
Banks
|
Banks-West/Southwest
|
1
|
Building
|
Building-Residentl/Comml
|
1
|
Business Services
|
Business Svcs-Advertising
|
1
|
Electronics
|
Electr-Misc Products
|
1
|
Finance
|
Finance-Savings&Loan
|
1
|
Healthcare
|
Healthcare-Drugs/Ethical
|
1
|
Healthcare
|
Healthcare-Outpnt/HmCare
|
1
|
Insurance
|
Insurance-Prop/Casualty/TItl
|
1
|
Insurance
|
Insurance-Diversified
|
1
|
Internet
|
Internet-ISP/Content
|
1
|
Internet
|
Internet-Software
|
1
|
Leisure
|
Leisure-Products
|
1
|
Oil & Gas
|
Oil & Gas-Field Services
|
1
|
Oil & Gas
|
Oil & Gas-U S Explr/Prod
|
1
|
Personal
|
Personal-Soap & Clng
|
1
|
Retail
|
Retail-Building Products
|
1
|
Steel
|
Steel -Specialty
|
1
|
Telecomm
|
Telecomm-Wireless Services
|
1
|
Telecomm
|
Telecomm-Services US
|
1
|
Utility
|
Utility-Gas
|
1
|
2This represents the return if each stock were bought at its breakout price and sold at its intraday high.
3This represents the return if each stock were bought at its breakout price and sold at the most recent close.
Category |
Symbol |
Company Name |
Expected Gain1 |
|---|---|---|---|
| Best Overall | SYKE | SYKES ENTERPRISES INC | 70 |
| Top Technical | CTMI | CTI MOLECULAR IMAGING INC | 14 |
| Top Fundamental | RRGB | RED ROBIN GOURMET BURGERS IN | 19 |
| Top Tech. & Fund. | RRGB | RED ROBIN GOURMET BURGERS IN | 19 |
Category |
Symbol |
Company Name |
Expected Gain1 |
|---|---|---|---|
| Best Overall | TALK | TALK AMERICA HLDGS INC | 63 |
| Top Technical | TALK | TALK AMERICA HLDGS INC | 63 |
| Top Fundamental | CAI | CACI INTL INC | 14 |
| Top Tech. & Fund. | LKQX | LKQ CORP | 20 |
If you received this newletter from a friend and you would like to receive it regularly please go to the BreakoutWatch.com site and enter as a Guest. You will then be able to register to receive the newsletter.
Copyright © 2005 NBIcharts, LLC dba BreakoutWatch.com. All rights reserved.