| Market Summary | Weekly Breakout Report | Top Breakout Choices | Top 2nd Chances | New Features | Tip of the Week |
Open House on Breakout Alerts
Our new Alert Monitor service is still on beta test and is free to all subscribers and guests until August 31. It can be accessed from our Take Action - Alerts menu choice at breakoutwatch.com. Read about further enhancements in this weeks Top Tip below.
Market Summary
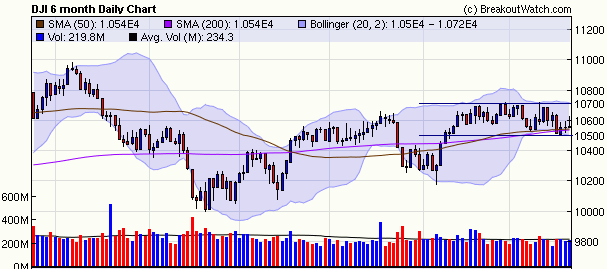
The DJI is still consolidating (but only just) while the NASDAQ Composite and the S&P 500 are under pressure. The DJI closed down slightly at 0.39%, the NASDAQ slid 0.99% and the S&P 500 lost 0.87%.
The DJI slipped below both the 50 and 200 day moving average levels on Tuesday but recovered on Wednesday and made slight gains on Thursday and Friday. While the DJI can still be seen to be in a consolidation pattern, trading between 10500 and 10700, a breakdown below the almost coincident 50 and 200 day moving average levels would be bearish.
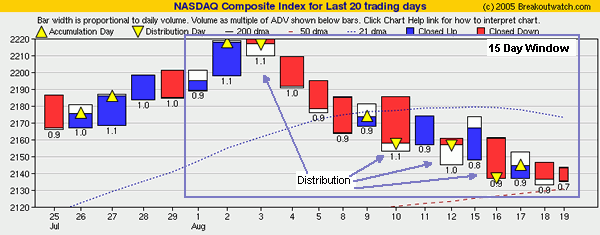
The NASDAQ Composite added another distribution day on Tuesday. Our market model will signal an 'exit' for this market, which also indicates broader weakness, if the count of distribution days reaches 5 in fifteen trading sessions. The count now is at 4 distribution days in 13 sessions, so another distribution day early next week could signal that the NASDAQ's rally is over. The daily accumulation/distribution count and relative volume levels are easily seen in our equivolume charts, published daily for the major indexes.
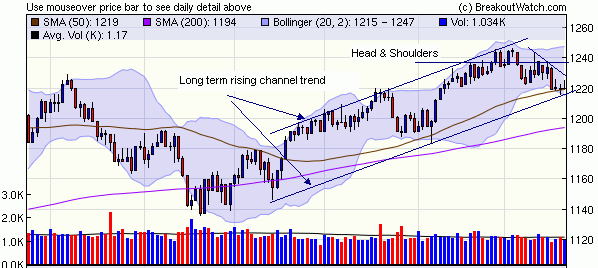
The S&P 500 is showing definite signs of weakness. It is still in a long term uptrend but tested the 50 day moving average level and the lower bounds of the rising channel on Thursday. A bearish Head & Shoulders pattern is now evident and the upside is limited by a descending triangle.
The Week's Breakouts
With the markets weakening, there were fewer breakouts this week, but they still easily beat the market averages. A (Agilent) broke out on Monday and reached a high that was 16.32% over its pivot and closed the week for a 14.45% gain. ADSK (Autodesk) also broke out on Monday and after settling into a short handle, broke out again on Thursday. Overall it gained 7.39% above its first pivot. Although the Retail sector generally reported a slower outlook for future sales, there were some bright spots and this sector contributed the most breakouts this week with a count of four.
The Weeks' Breakdowns
We reported 3 confirmed breakdowns this week, SUG (Southern Union), TTC (Toro Co.), and RRA(RailAmerica Inc.).
Get a 14 day Trial of our premium 'Platinum' service for just $9.95 and if you subsequently subscribe to any subscription level we will credit your $9.95 to your subscription. 14
Day Platinum Trial |
Our email alert was enhanced to include the Right Cup Quality (RCQ) and Handle Quality (HQ) metrics.
The Alert Monitor, which is in beta test and open to all subscribers and guests, was further enhanced, as described below.
New Alert Monitor Enhancements
Thank you to all of you who pointed out a few bugs in the new Alert Monitor and made suggestions for enhancements. Please keep them coming.
The bugs have been fixed (although there could still be some remaining, or new ones introduced by the enhancements) and most of the enhancements included now. The principle enhancements are:
- ability to toggle the size of the chart between 'medium' (600px wide) and 'large' (800px wide).
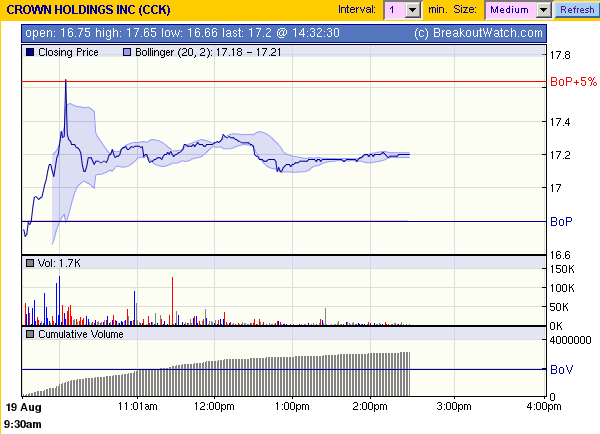
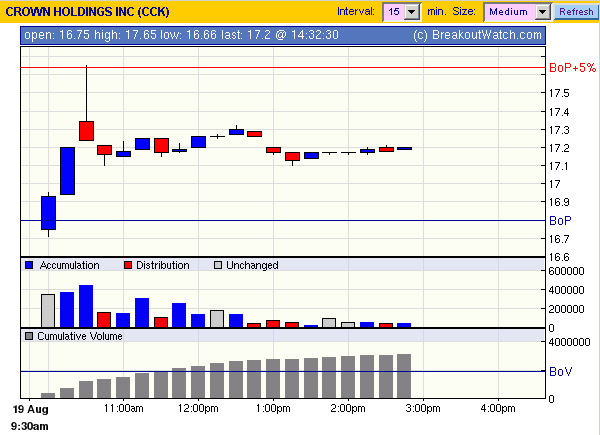
- choose a time interval for the display between 1 and 30 minutes. The one minute chart is displayed as a line chart while larger intervals are shown as a candlestick chart. Examples are shown below.
- Bollinger Bands (20 min, 2 SD) are shown on 1 minute charts but not on charts for longer time intervals.
- addition of a 'BoP + 5%' line to show the usual limit price on buying breakouts. (Only shows when the price is very close to the BoP or has passed it).
Here is an example of a 1 minute chart from yesterday at 2:30 pm for CCK. The chart shows the 'closing price' at the end of the 1 minute interval. (Note, CCK never actually crossed the BoP+5% line yesterday, the data was modified so that the BoP+5% line would be shown for demonstration purposes).
Here is a 15 minute for the same symbol at the same time. Note that the volume bars show whether accumulation (price rose) or distribution (price fell) occurred over the interval.
Investment Advisors Using our Service
If you are interested in basing part of your investment strategy on our service, but do not have the time, experience or confidence to do so on your own account, then consider using an investment advisor.
TradeRight Securities, located in a suburb of Chicago, is a full services investment management company and broker/dealer. They have been a subscriber, and user, of BreakoutWatch.com for some time now. They practice CANTATA and use Breakoutwatch.com as a “research analyst”.
They also provide:
• A hands-on approach through personalized service
•
On-going communication, guidance, and consultation
•
An environment that working together with their clients will help them reach
their financial goals
You can learn more about TradeRight Securities at: www.traderightsecurities.com.
If you’re interested
in speaking to a representative, simply call them toll-free at 1-800-308-3938
or e-mail gdragel@traderightsecurities.com.
Get a 14 day Trial of our premium 'Platinum' service for just $9.95 and if you subsequently subscribe to any subscription level we will credit your $9.95 to your subscription. 14
Day Platinum Trial |
| Index | Value | Change Week | Change YTD | Market1 Signal |
||||||||||||||||||||||||||||||||||||
|---|---|---|---|---|---|---|---|---|---|---|---|---|---|---|---|---|---|---|---|---|---|---|---|---|---|---|---|---|---|---|---|---|---|---|---|---|---|---|---|---|
| Dow | 10559.2 | -0.39% | -2.08% | enter | ||||||||||||||||||||||||||||||||||||
| NASDAQ | 2135.56 | -0.99% | -1.83% | enter | ||||||||||||||||||||||||||||||||||||
| S&P 500 | 1219.71 | -0.87% | 0.64% | enter | ||||||||||||||||||||||||||||||||||||
1The Market Signal is derived from our proprietary
market model. The market model is described on the site. 2The site also shows industry rankings based on fundamentals, combined technical and fundamentals, and on price alone (similar to IBD). The site also shows daily industry movements. |
||||||||||||||||||||||||||||||||||||||||
# of Breakouts
|
Period Average1
|
Max. Gain During Period2
|
Gain at Period Close3
|
|
|---|---|---|---|---|
| This Week | 22 | 37.77 | 4.19% | 0.85% |
| Last Week | 30 | 39.77 | 4.85% | -0.63% |
| 13 Weeks | 507 | 41.31 | 15.06% |
3.97% |
Sector
|
Industry
|
Breakout Count for Week
|
|---|---|---|
Oil & Gas
|
Oil & Gas-U S Explr/Prod
|
2
|
Retail
|
Retail-Mail Order/Direct
|
2
|
Aerospace & Defense
|
Aerospace & Defense-Equip
|
1
|
Computer
|
Computer-Graphics
|
1
|
Computer Software
|
Comp Software-Security
|
1
|
Computer Software
|
Comp Software-Enterprise
|
1
|
Containers
|
Containers
|
1
|
Diversified Operations
|
Diversified Operations
|
1
|
Healthcare
|
Healthcare-Drugs/Ethical
|
1
|
Insurance
|
Insurance-Life
|
1
|
Internet
|
Internet-Software
|
1
|
Internet
|
Internet-ISP/Content
|
1
|
Media
|
Media-Radio/TV
|
1
|
Oil & Gas
|
Oil & Gas-Prod/Pipeline
|
1
|
Personal
|
Personal-Shoes
|
1
|
Retail
|
Retail-Auto Parts
|
1
|
Retail
|
Retail-Restaurant
|
1
|
Transportation
|
Transportation-Rail
|
1
|
Transportation
|
Transportation-Ship
|
1
|
2This represents the return if each stock were bought at its breakout price and sold at its intraday high.
3This represents the return if each stock were bought at its breakout price and sold at the most recent close.
Category |
Symbol |
Company Name |
Expected Gain1 |
|---|---|---|---|
| Best Overall | APLX | APPLIX INC | 121 |
| Top Technical | KG | KING PHARMACEUTICALS INC | 59 |
| Top Fundamental | DRIV | DIGITAL RIV INC | 64 |
| Top Tech. & Fund. | DRIV | DIGITAL RIV INC | 64 |
Category |
Symbol |
Company Name |
Expected Gain1 |
|---|---|---|---|
| Best Overall | ICGE | INTERNET CAP GROUP INC | 91 |
| Top Technical | MSTR | MICROSTRATEGY INC | 50 |
| Top Fundamental | MSTR | MICROSTRATEGY INC | 50 |
| Top Tech. & Fund. | MSTR | MICROSTRATEGY INC | 50 |
If you received this newletter from a friend and you would like to receive it regularly please go to the BreakoutWatch.com site and enter as a Guest. You will then be able to register to receive the newsletter.
Copyright © 2005 NBIcharts, LLC dba BreakoutWatch.com. All rights reserved.