| Market Summary | Weekly Breakout Report | Top Breakout Choices | Top 2nd Chances | New Features | Tip of the Week |
Market Summary
The markets staged a mild recovery on Friday following the release of benign inflation data, improved retail sales figures and strong quarterly earnings from General Electric. The recovery was moderated, however, by a fall in the University of Michigan's consumer sentiment index to well below expectations. Friday's recovery, the second positive move in succession for the NASDAQ Composite, was insufficient to lift the indexes into positive territory for the week. The DJI slipped narrowly by 0.05% while the NASDAQ fell more steeply with a 1.22% loss and the S&P 500 gave up 0.78%.
Thursday's turnaround in the downward advance of the NASDAQ was a welcome relief, and it was reassuring to see the turnaround continue on Friday. The NASDAQ was at levels not seen since early July after falling through the 2050 resistance level we discussed last week, and a further fall to below 2000 looked possible. Two positive days don't mean that a recovery is in progress, however, and we must wait for a confirmation day before we can declare the recent slide to be checked. The requirements for a confirmation day were discussed in last weeks newsletter.
The number of confirmed breakouts fell to seventeen this week and most had difficulty keeping their head above water. Those that did make substantial gains, Monolithic Power Systems (MPWR ) and On-Line Reservation Corp. (ORCC) had both shown considerable strength while in their handles as they resisted the general downwards pressure to make positive price moves on above average volume. We have often indicated that this kind of price/volume action in the handle can herald a coming breakout.
Our ShortsaleWatch service confirmed 20 breakdowns this week of which six fell by more than 5%.
Get a 14 day Trial of our premium 'Platinum' service for just $9.95 and if you subsequently subscribe to any subscription level we will credit your $9.95 to your subscription. 14
Day Platinum Trial |
Bollinger Band 'Bands'
 We've
added a new option to our Technical Analysis Charts that allows the display
of Bollinger Bands for both 1 and 2 standard deviations from the 20 day moving
average. The result is two Bollinger Bands that can be very useful in spotting
trend reversals and generating sell alert signals. The new option is obtained
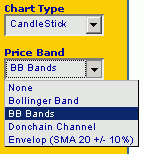
by selecting 'BB Bands ' as a Price Band option in our Technical Analysis
charts control panel.
Examples of the use of the new feature are given below.
Using Bollinger Band 'Bands' to Detect Trend Reversals and Sell Signals
We first discussed Bollinger Bands in our newsletter of 8/27/05 shortly after we introduced our Technical Analysis Charts (T/ACharts) service. Two of the points we emphasized was that a move outside the bands did not necessarily mean it was time to sell (or buy) and that stocks tend to walk-up (or walk-down) the bands. In view of this, how can Bollinger Bands help us with our sell decisions?
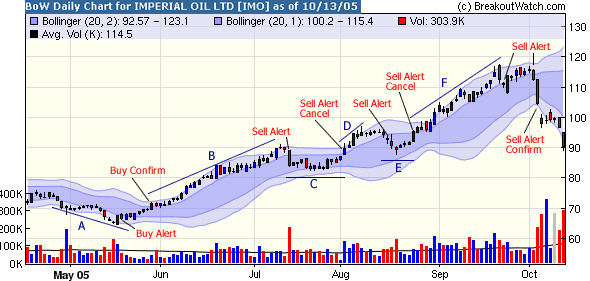
This week we added a new option, 'BB Bands' to our T/A Charts that goes some way towards answering that question. When you choose BB Bands as a Price Band option you will get a chart with Bollinger Bands drawn at the 1 standard deviation level as well as the normal 2 standard deviations. To illustrate how the BB Bands can serve to confirm trend changes, here's an example of Imperial Oil (IMO) the top ranked stock in the top ranked Oil and Gas Canadian group that has performed so well this year.

- Trend A shows the stock tracking between the lower two bands with a possible change in trend signaled as it crosses the inner band to the upside. This is labeled 'Buy Alert'.
- Trend B begins when the stock crosses out of the inner band to the outer band. This is labeled 'Buy Confirm'.
- Trend B continues until the stock closes within the inner band for the first time. This is labeled 'Sell Alert'.
- The stock now consolidates in area C. Notice that it never closes below the lower inner trend line but re-crosses the upper inner trend line at which point the sell alert is cancelled.
- The stock now walks up the outer band until another Sell Alert is issued at the start of area E.
- Another period of consolidation begins (E) and the Sell Alert is cancelled as the consolidation is completed and the stock moves out of the inner-band to the upside.
- Trend F now begins as the stock again walks up the outer band. A brief Sell Alert is issued in late September which is cancelled the following day (not shown). Another Sell Alert is issued on October 4 and confirmed on October 5 as the stock closes below the lower inner band.
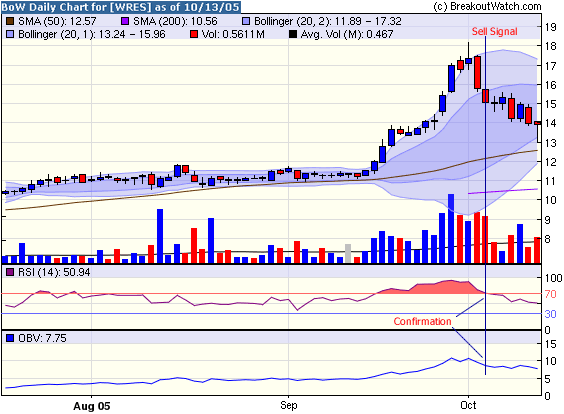
The strategy shown is a conservative one where a confirmation is required before the buy or sell alert is confirmed. A riskier strategy is to buy or sell on the initial alert but in that case it is desirable to have confirmation from other non-correlated indicators such as the RSI (or MACD) and On Balance Volume. (Note that the RSI and MACD should not be used together as they are both derived from closing price data alone). Using the BB Bands in conjunction with these indicators can help us determine when to sell a breakout that we might be holding. Here's an example of a recent breakout (9/16) that rose 53.5% in twelve sessions.

Following breakout the stock walked up the outer band but a sell signal was given on 10/5 when the stock closed within the inner band. This sell signal was confirmed on the same date as the RSI dropped below the overbought line and the On Balance Volume (OBV) was clearly in decline.
Get a 14 day Trial of our premium 'Platinum' service for just $9.95 and if you subsequently subscribe to any subscription level we will credit your $9.95 to your subscription. 14
Day Platinum Trial |
| Index | Value | Change Week | Change YTD | Market1 Signal |
||||||||||||||||||||||||||||||||||||
|---|---|---|---|---|---|---|---|---|---|---|---|---|---|---|---|---|---|---|---|---|---|---|---|---|---|---|---|---|---|---|---|---|---|---|---|---|---|---|---|---|
| Dow | 10287.3 | -0.05% | -4.6% | enter | ||||||||||||||||||||||||||||||||||||
| NASDAQ | 2064.83 | -1.22% | -5.08% | exit | ||||||||||||||||||||||||||||||||||||
| S&P 500 | 1186.57 | -0.78% | -2.09% | enter | ||||||||||||||||||||||||||||||||||||
1The Market Signal is derived from our proprietary
market model. The market model is described on the site. 2The site also shows industry rankings based on fundamentals, combined technical and fundamentals, and on price alone (similar to IBD). The site also shows daily industry movements. |
||||||||||||||||||||||||||||||||||||||||
# of Breakouts
|
Period Average1
|
Max. Gain During Period2
|
Gain at Period Close3
|
|
|---|---|---|---|---|
| This Week | 17 | 28.85 | -1.66% | -4.62% |
| Last Week | 34 | 32.31 | 3.11% | -3.82% |
| 13 Weeks | 443 | 32.62 | 11.74% |
-1.84% |
Sector
|
Industry
|
Breakout Count for Week
|
|---|---|---|
Banks
|
Banks-Midwest
|
3
|
Insurance
|
Insurance-Prop/Casualty/TItl
|
2
|
Special
|
Special-ClsdEndFunds/Bond
|
2
|
Utility
|
Utility-Electric
|
2
|
Banks
|
Banks-Money Center
|
1
|
Computer Software
|
Comp Software-Financial
|
1
|
Diversified Operations
|
Diversified Operations
|
1
|
Electronics
|
Electr-Semicndtr Mfg
|
1
|
Finance
|
Finance-Invest Management
|
1
|
Media
|
Media-Books
|
1
|
Retail
|
Retail-Supermarkets
|
1
|
Transportation
|
Transportation -Airlines
|
1
|
2This represents the return if each stock were bought at its breakout price and sold at its intraday high.
3This represents the return if each stock were bought at its breakout price and sold at the most recent close.
Category |
Symbol |
Company Name |
Expected Gain1 |
|---|---|---|---|
| Best Overall | SRSL | SRS LABS INC | 64 |
| Top Technical | BTM | BRASIL TELECOM SA | 22 |
| Top Fundamental | RJET | Republic Airways Holdings Inc. | 17 |
| Top Tech. & Fund. | RJET | Republic Airways Holdings Inc. | 17 |
Category |
Symbol |
Company Name |
Expected Gain1 |
|---|---|---|---|
| Best Overall | ORCC | ONLINE RES CORP | 36 |
| Top Technical | ORCC | ONLINE RES CORP | 36 |
| Top Fundamental | RJET | Republic Airways Holdings Inc. | 24 |
| Top Tech. & Fund. | RJET | Republic Airways Holdings Inc. | 24 |
If you received this newletter from a friend and you would like to receive it regularly please go to the BreakoutWatch.com site and enter as a Guest. You will then be able to register to receive the newsletter.
Copyright © 2005 NBIcharts, LLC dba BreakoutWatch.com. All rights reserved.