| Market Summary | Weekly Breakout Report | Top Breakout Choices | Top 2nd Chances | New Features | Tip of the Week |
Market Summary
The markets closed higher after a turbulent week in which our market model reversed itself twice. After being reassured on Monday by the choice of Ben Bernanke to head the Federal Reserve, there was a pullback on Tuesday as the Conference Board reported a drop in consumer confidence, oil prices rose and Texas Instruments lowered fourth quarter estimates. Our market model responded by issuing an 'exit' signal for the volatile NASDAQ. Wednesday brought news of further lowered expectations and the selloff strengthened to be reinforced on Thursday as the market recognized that Bernanke was likely to continue the policy of raising rates to curb energy cost induced inflation, while the same energy costs threatened to damage economic growth, thereby delivering a double-whammy to company profit margins. Up until then, one could consider the markets were behaving rationally as they looked to the future and didn't like what they saw. That was forgotten about on Friday as the Commerce Department reported better than expected third quarter growth. Euphoria reigned despite further profit warnings, a small rise in crude oil prices and confirmation from the University of Michigan that consumer confidence was indeed falling. The indexes recovered most of their losses since Monday to close the week for a narrow gain and our market model issued an 'enter' signal.. It was as if the markets looked in their rear view mirror and liked where they had been and set aside their previous concerns.
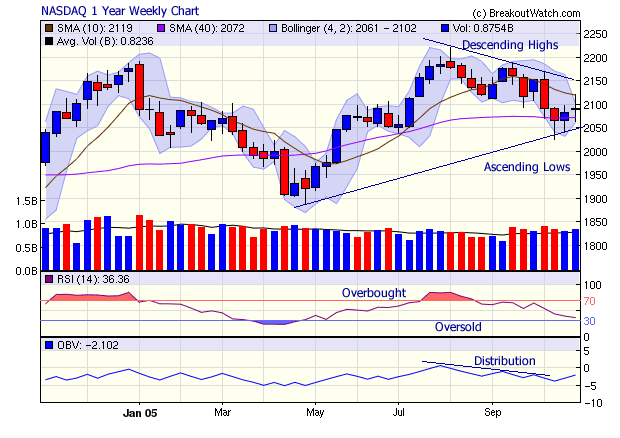
Last week, we incorrectly drew the position of the head and shoulders neckline on the NASDAQ chart, but our overall thrust was that the NASDAQ was in decline. This week, we see some price stabilization and accumulation with the On Balance Volume starting to rise after 10 weeks of distribution. A look at the 1 year weekly chart shows the NASDAQ trading between its upper 50 dma line of resistance and lower 200 dma line of support. The high and low trend lines are converging and the Bollinger Bands are narrowing. These indications are that the NASDAQ is approaching a point where a breakout to the upside or to the downside could occur. A hold above the 50 dma and a cross of the descending trend line would confirm a breakout to the upside while a hold below the 200 dma and a cross below the ascending trendline would confirm a breakdown.

This week saw 21 successful breakouts with the Healthcare Sector contributing four to the count. Regernon (REGN) broke out Monday and after a slight pull back continued to rise on Thursday and Friday for an overall gain on the week of 14.6% over its pivot. Selective Ins. (SIGI), Flow International (FLOWE), and Hittite Microwave all made 7% gains over their pivot.
Get a 14 day Trial of our premium 'Platinum' service for just $9.95 and if you subsequently subscribe to any subscription level we will credit your $9.95 to your subscription. 14
Day Platinum Trial |
T/A Charts Enhancements
We enhanced our Technical Analysis Charts this week in two ways.
-
We added a 'cross hair' that moves with the mouse and allows you to easily line-up points on several vertically stacked charts and also see axis intercepts.
- If you increase the size of a chart, the new size will be used for each T/A Chart you select. You can also save this size preference along with all your other chart preferences.
One subscriber reacted by saying "I've been playing with this all morning. It is really amazing being able to tell support levels, resistance levels and pinpointing the same exact time on all the technical indicators. I truly think this makes your t/a charts the best in the online business (I have seen a lot)."
New CwHwatch Metric
See below.
New Price/Volume Indicator Related to Breakout Probability and Long Term Gains
This week we continue to look at new metrics we are introducing which will improve our subscriber's returns through increasing the chances of selecting successful breakouts and those most likely to make higher longer term gains.
Last week we introduced our new Handle Quality (HQ) metric. This week we introduce the Price/Volume Indicator, or PVI. PVI is a new column under the CWH Metrics tab on CwHwatch. We will show you how filtering on PVI
- selects 75% of breakout attempts
- improves longer term breakout gains by up to 18%.
We have often drawn attention to our observation that breakouts are related to the price/volume action on the day before breakout. However, until now we have not provided a metric that allowed the easy selection of stocks with positive price/volume action on the day the watchlist is published .
The new PVI classifies the price/volume action on the day the watchlist is published by looking at three conditions :
- did the stock close higher than the day before?
- if so, was the volume greater than the day before?
- if so, was the volume greater than the day before and above average?
the answers to these questions result in 5 possible classifications for the PVI as follows
| Price/Volume Action | PVI |
|---|---|
Price does not rise over previous day |
0 |
Price rises over previous day on lower volume and volume less than average |
0.2 |
Price rises over previous day on higher volume and volume less than average |
0.5 |
Price rises over previous day on lower volume and volume is above average |
0.6 |
Price rises above the previous day and volume is above average |
0.9 |
It is important to understand that the values assigned to the PVI are to allow us to classify the possibilities and are not intended to imply relativity between the classifications. That is, a PVI of 0.6 is not 3 times better than a PVI of 2, for example.
The Relationship between PVI and Breakout Attempts and Successes
Since we introduced our current CwH algorithm in April 2003, there have been
50,546 separate listings on CwHwatch. We analyzed all these cases and found
that 75%
of all breakout attempts occurred where the price had risen over the previous
day.
Of those breakouts that were successful, the price had risen 72% of the time
on the
previous day. Of
the successful breakouts, 60% rose on higher volume on the day before breakout (PVI
classes 0.5 and 0.9).
Results Since April 2003 | PVI | Total | ||||
|---|---|---|---|---|---|---|
0 | 0.2 | 0.5 | 0.6 | 0.9 | ||
Watchlist Cases | 50546 | 22335 | 13419 | 4180 | 1114 | 91594 |
Breakout Attempts | 1272 | 1237 | 909 | 388 | 1296 | 5102 |
Breakout Successes | 819 | 585 | 447 | 264 | 820 | 2935 |
PVI as % of Total Attempts | 24.93% | 24.25% | 17.82% | 7.60% | 25.40% | 100.00% |
% with PVI > 0 | 32.30% | 23.73% | 10.13% | 33.84% | 75.07% | |
PVI as % of Total Successes | 27.90% | 19.93% | 15.23% | 8.99% | 27.94% | 100.00% |
%
with PVI > 0 |
27.65% | 21.12% | 12.48% | 38.75% | 72.10% |
|
The Relationship between PVI and Longer Term Gains
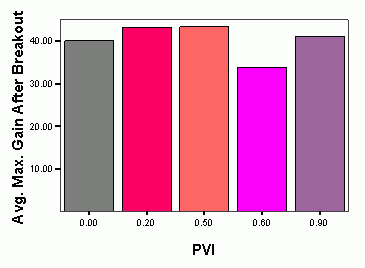
Looking at the average maximum gains after breakout since April 2003, we see that there is little difference between the average maximum gain between the different PVI classes.

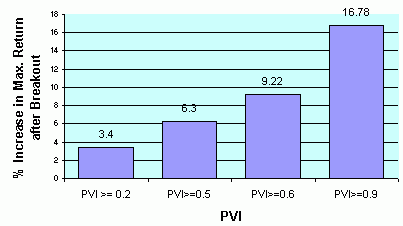
However, if we look at the average gains over a shorter period of 13 weeks (using our backtest feature) we see that we can improve the maximum gain by filtering for different values of PVI as the following chart shows:

It is important to note that filtering for PVI does not improve the return on the breakout day itself. While this might seem counter intuitive, I postulate that this is because the major price move was made on the day before breakout as aresult of instituional buying.
PVI is a new column under the CWH Metrics tab on CwHwatch.
Investment Advisors Using our Service
If you are interested in basing part of your investment strategy on our service, but do not have the time, experience or confidence to do so on your own account, then consider using an investment advisor.
TradeRight Securities, located in a suburb of Chicago, is a full services investment management company and broker/dealer. They have been a subscriber, and user, of BreakoutWatch.com for some time now. They practice CANTATA and use Breakoutwatch.com as a “research analyst”.
They also provide:
• A hands-on approach through personalized service
•
On-going communication, guidance, and consultation
•
An environment that working together with their clients will help them reach
their financial goals
You can learn more about TradeRight Securities at: www.traderightsecurities.com. If you’re interested in speaking to a representative, simply call them toll-free at 1-800-308-3938 or e-mail gdragel@traderightsecurities.com.
Get a 14 day Trial of our premium 'Platinum' service for just $9.95 and if you subsequently subscribe to any subscription level we will credit your $9.95 to your subscription. 14
Day Platinum Trial |
| Index | Value | Change Week | Change YTD | Market1 Signal |
||||||||||||||||||||||||||||||||||||
|---|---|---|---|---|---|---|---|---|---|---|---|---|---|---|---|---|---|---|---|---|---|---|---|---|---|---|---|---|---|---|---|---|---|---|---|---|---|---|---|---|
| Dow | 10402.8 | 1.84% | -3.53% | enter | ||||||||||||||||||||||||||||||||||||
| NASDAQ | 2089.88 | 0.37% | -3.93% | enter | ||||||||||||||||||||||||||||||||||||
| S&P 500 | 1198.41 | 1.6% | -1.11% | enter | ||||||||||||||||||||||||||||||||||||
1The Market Signal is derived from our proprietary
market model. The market model is described on the site. 2The site also shows industry rankings based on fundamentals, combined technical and fundamentals, and on price alone (similar to IBD). The site also shows daily industry movements. |
||||||||||||||||||||||||||||||||||||||||
# of Breakouts
|
Period Average1
|
Max. Gain During Period2
|
Gain at Period Close3
|
|
|---|---|---|---|---|
| This Week | 21 | 24.69 | 4.49% | 0.84% |
| Last Week | 31 | 26.46 | 6.73% | 2.25% |
| 13 Weeks | 393 | 27.92 | 10.44% |
-1.32% |
Sector
|
Industry
|
Breakout Count for Week
|
|---|---|---|
Healthcare
|
Healthcare-Biomed/Genetic
|
3
|
Textile
|
Textile-Apparel Mfg
|
3
|
Insurance
|
Insurance-Prop/Casualty/TItl
|
2
|
Banks
|
Banks-Southeast
|
1
|
Business Services
|
Business Svcs-Misc
|
1
|
Chemical
|
Chemical-Specialty
|
1
|
Computer Software
|
Comp Software-Financial
|
1
|
Computer Software
|
Comp Software-Security
|
1
|
Electronics
|
Electr-Semicndtr Mfg
|
1
|
Finance
|
Finance-Savings&Loan
|
1
|
Healthcare
|
Healthcare-Med/Dent Services
|
1
|
Insurance
|
Insurance-Acc/Health
|
1
|
Machinery
|
Machinery-Machine Tools
|
1
|
Steel
|
Steel -Producers
|
1
|
Telecomm
|
Telecomm-Equipment
|
1
|
Transportation
|
Transportation -Airlines
|
1
|
2This represents the return if each stock were bought at its breakout price and sold at its intraday high.
3This represents the return if each stock were bought at its breakout price and sold at the most recent close.
Category |
Symbol |
Company Name |
Expected Gain1 |
|---|---|---|---|
| Best Overall | ACCL | Accelrys Inc. | 62 |
| Top Technical | CAMD | CALIFORNIA MICRO DEVICES COR | 28 |
| Top Fundamental | ASPM | ASPECT MED SYS INC | 11 |
| Top Tech. & Fund. | ASPM | ASPECT MED SYS INC | 11 |
Category |
Symbol |
Company Name |
Expected Gain1 |
|---|---|---|---|
| Best Overall | SNWL | SONICWALL INC | 33 |
| Top Technical | SNWL | SONICWALL INC | 33 |
| Top Fundamental | CRDN | CERADYNE INC CALIF | 29 |
| Top Tech. & Fund. | WES | WESTCORP INC | 3 |
If you received this newletter from a friend and you would like to receive it regularly please go to the BreakoutWatch.com site and enter as a Guest. You will then be able to register to receive the newsletter.
Copyright © 2005 NBIcharts, LLC dba BreakoutWatch.com. All rights reserved.