| Market Summary | Weekly Breakout Report | Top Breakout Choices | Top 2nd Chances | New Features | Tip of the Week |
Market Summary
The rally that began on October 13 continued this week and allowed the three major indexes to set highs not seen in over four years. Both the NASDAQ and the S&P 500 closed the week at their highest level for the year while the DJI closed slightly down on it's day's high on Friday and just failed to break even for the year. Overall, the DJI gained 0.75% for the week while the NASDAQ added 1.12% and the S&P 500 rose 1.1%. The NASDAQ closed on Thursday at its uppermost resistance level of the year at 2220 and then broke through that level on Friday to set a new mark of 2234 on higher than average volume. Better than expected results from technology stocks accompanied by falling energy prices fueled the weeks gains and most sectors participated in the advance. Friday's action was particularly interesting as the markets trended higher and then slumped in mid session only to rally again in the afternoon. Normally one would expect trading to trail off late on Friday afternoon but a recovery, especially on the NASDAQ and S&P to near session highs, was particularly bullish.
In another bullish sign, the number of breakouts continued at a high level this week and their average gain for the week more than doubled that of the indexes. Sigma Designs (SIGM) broke out on Tuesday to close in-range at 1.5% over its pivot and then settled into a short handle before making a strong breakout on Friday to close 13.9% above Tuesday's breakout price. This is an excellent example of why we include stocks on our watchlist that have handles as short as two days instead of the recommended five day minimum. Another double-digit gainer was Sify Ltd (SIFY) with a gain of 14.1%.
Special Offers
Silver and Gold subscribers will be automatically upgraded to Platinum status until Monday, November 19, to allow them to evaluate our new metrics and the filter strategy detailed in last week's Top Tip. This week we introduce Breakoutwatch for Traders and Silver and Gold subscribers will have access to that until Monday also.
Guests will be given full Platinum privileges over Thanksgiving weekend from November 24 to 27. This is a great opportunity for newsletter subscribers who are not yet full subscribers to take advantage of our very rich tool set.
Thanksgiving Day
We wish all our newsletter subscribers a safe and happy Thanksgiving. There will be no newsletter next week as the team takes a break after all the recent enhancements.
Get a 14 day Trial of our premium 'Platinum' service for just $9.95 and if you subsequently subscribe to any subscription level we will credit your $9.95 to your subscription. 14
Day Platinum Trial |
Parabolic Sar
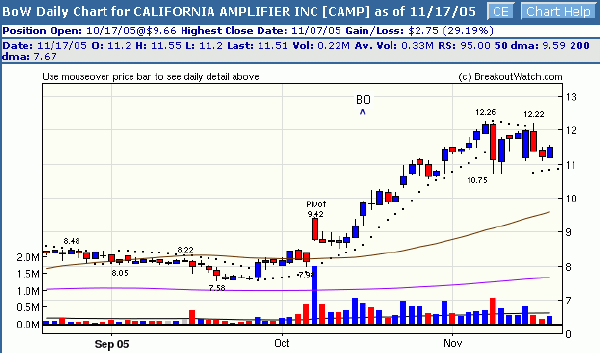
The Parabolic Sar indicator is now an option on the Technical Analysis Charts tool. The Parabolic SAR (for Stop and Reverse and the shape the indicator assumes) is considered useful for setting trailing stops on both the long and short side provided the stock is trending up or down. The Parabolic SAR can be added to a chart by selecting it in one of the four Technical Indicators boxes. Here's an example of the Parabolic Sar applied to a recent breakout.

'BOW' Button
A new button was added to the CwHwatch display which automatically sets the filters to those recommended in last weeks newsletter.
Breakoutwatch for Traders
We introduce a new service this week, 'Breakoutwatch for Traders'. This service is based on our work over the last few months to examine the filters that give the best returns and provides a simple one-click method to access stocks selected from our Cup-with-Handle watchlist that will give outstanding returns. There are three lists designed to meet three trading styles:
-
Stocks providing the best return over several weeks to months
- Stocks that will give the best return over a 1 to 2 week period (Swing Traders)
- Stocks that have the potential to give the best one day gains. (Day Traders)
This new service is discussed below.
 No
matter what your trading style, breakoutwatch now offers a service that promises
to give you outstanding returns without the necessity to
understand any of our metrics or undertake extensive due diligence. The
new service is accessed from the navigation bar by clicking the 'Breakoutwatch
Trader' menu selection. This will take you to a page displaying three lists
of stocks. The lists are derived from our research into stocks that have broken
out from our cup-with-handle watchlist since April 2003. They are designed
to give the best returns over several months, a few days or a single day.
The criteria used are highly selective and there will not always be a candidate
in each list category.
Stocks Providing Best Return after Breakout
This list is based on the filters we described last week augmented with the results of additional unpublished research. This research showed that there were some components of our CE (CANTATA Evaluator) that are not accessible through our watchlist filters that could be used to further improve the probability of breakout and longer term returns. The list also includes a recommended bid price based on the bidding strategy we also described next week. To get the best returns from this list a buy/stop order should be entered before the market opens so a fill price closest to the bid price is obtained. We also suggest using a limit of, say, 10c higher than the bid, so you do not get filled if the stock gaps up substantially over the breakout price. The historical results (accessible from the 'View History' button) are based on a buy/stop/limit order using these constraints.

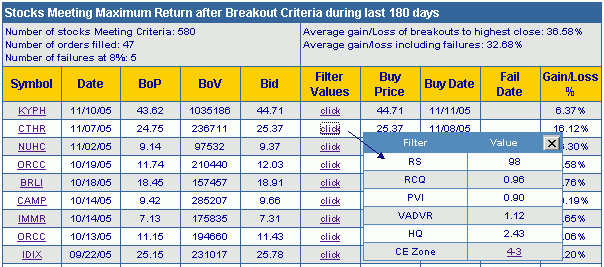
Clicking the 'View History' button brings up a list of stocks that would have been bought from the list over the last 180 days and a summary of the possible returns that would have been obtained. The list is in reverse date order. Clicking the symbol shows a chart of the CwH pattern as it was when the stock would have been on the list and its subsequent performance. The filter values at that time can also be seen. The Gain/Loss is calculated on the assumption that the stock is sold at the highest close following opening the position.

Stocks Meeting Swing Trade Criteria
This list is compiled using filters optimized to give the best return over a five day period. Note that the bid price is usually below the breakout price so that the maximum return can be obtained. It therefore includes stocks that have a high probability of breaking out. Stocks bought using this strategy can be held, even if the breakout is not confirmed and the results given under the 'View History' list reflect that. The Gain/Loss is calculated on the assumption that the stock is sold at the highest close with 14 days following opening the position.
Stocks Meeting Day Trade Criteria
This list is compiled using filters optimized to give the best one day return. Note that the bid price is usually below the breakout price so that the maximum return can be obtained. It therefore includes stocks that have a high probability of breaking out. The results shown in the 'View History' assume that the position is closed at the stock's high of the day.
Access to the Breakoutwatch for Traders Service
Access is limited to Platinum subscribers until January 1, 2006. After then it will be available to all subscribers at a premium of $39.95 per month over their basic subscription.
Silver and Gold subscribers continue to be automatically upgraded to Platinum status until midnight EST on Monday, November 21 and can therefore access this service until then.
Guests will be given full Platinum privileges over Thanksgiving weekend from November 24 to 27. This is a great opportunity for newsletter subscribers who are not yet full subscribers to take advantage of our very rich tool set.
Investment Advisors Using our Service
If you are interested in basing part of your investment strategy on our service, but do not have the time, experience or confidence to do so on your own account, then consider using an investment advisor.
TradeRight Securities, located in a suburb of Chicago, is a full services investment management company and broker/dealer. They have been a subscriber, and user, of BreakoutWatch.com for some time now. They practice CANTATA and use Breakoutwatch.com as a “research analyst”.
They also provide:
• A hands-on approach through personalized service
•
On-going communication, guidance, and consultation
•
An environment that working together with their clients will help them reach
their financial goals
You can learn more about TradeRight Securities at: www.traderightsecurities.com. If you’re interested in speaking to a representative, simply call them toll-free at 1-800-308-3938 or e-mail gdragel@traderightsecurities.com.
Get a 14 day Trial of our premium 'Platinum' service for just $9.95 and if you subsequently subscribe to any subscription level we will credit your $9.95 to your subscription. 14
Day Platinum Trial |
| Index | Value | Change Week | Change YTD | Market1 Signal |
||||||||||||||||||||||||||||||||||||
|---|---|---|---|---|---|---|---|---|---|---|---|---|---|---|---|---|---|---|---|---|---|---|---|---|---|---|---|---|---|---|---|---|---|---|---|---|---|---|---|---|
| Dow | 10766.3 | 0.75% | -0.15% | enter | ||||||||||||||||||||||||||||||||||||
| NASDAQ | 2227.07 | 1.12% | 2.37% | enter | ||||||||||||||||||||||||||||||||||||
| S&P 500 | 1248.27 | 1.1% | 3% | enter | ||||||||||||||||||||||||||||||||||||
1The Market Signal is derived from our proprietary
market model. The market model is described on the site. 2The site also shows industry rankings based on fundamentals, combined technical and fundamentals, and on price alone (similar to IBD). The site also shows daily industry movements. |
||||||||||||||||||||||||||||||||||||||||
# of Breakouts
|
Period Average1
|
Max. Gain During Period2
|
Gain at Period Close3
|
|
|---|---|---|---|---|
| This Week | 40 | 26.54 | 4.35% | 2.51% |
| Last Week | 41 | 25.38 | 8.32% | 5.23% |
| 13 Weeks | 418 | 28.08 | 10.87% |
3.81% |
Sector
|
Industry
|
Breakout Count for Week
|
|---|---|---|
Mining
|
Mining-Gold/Silver/Gems
|
4
|
Retail
|
Retail-Apparel
|
4
|
Banks
|
Banks-Foreign
|
2
|
Special
|
Special-ClsdEndFunds/Bond
|
2
|
Transportation
|
Transportation -Airlines
|
2
|
Aerospace & Defense
|
Aerospace & Defense-Electr
|
1
|
Auto & Truck
|
Auto & Truck-OEM
|
1
|
Business Services
|
Business Svcs-Staffing
|
1
|
Business Services
|
Business Svcs-Advertising
|
1
|
Computer
|
Computer-Makers
|
1
|
Computer
|
Computer-Integrated Sys
|
1
|
Computer Software
|
Comp Software-Enterprise
|
1
|
Diversified Operations
|
Diversified Operations
|
1
|
Electronics
|
Electr-Semicndtr Mfg
|
1
|
Finance
|
Finance-Brokers
|
1
|
Healthcare
|
Healthcare-Biomed/Genetic
|
1
|
Healthcare
|
Healthcare-Products
|
1
|
Healthcare
|
Healthcare-Outpnt/HmCare
|
1
|
Healthcare
|
Healthcare-Instruments
|
1
|
Insurance
|
Insurance-Diversified
|
1
|
Internet
|
Internet-Secur/Network Svcs
|
1
|
Internet
|
Internet-ISP/Content
|
1
|
Leisure
|
Leisure-Htls/Mtls
|
1
|
Mining
|
Mining-Misc Ores
|
1
|
None
|
None
|
1
|
Retail
|
Retail-Jewelry
|
1
|
Special
|
Special-Market/Tracking Funds
|
1
|
Telecomm
|
Telecomm-Services Fgn
|
1
|
Textile
|
Textile-Apparel Mfg
|
1
|
2This represents the return if each stock were bought at its breakout price and sold at its intraday high.
3This represents the return if each stock were bought at its breakout price and sold at the most recent close.
Category |
Symbol |
Company Name |
Expected Gain1 |
|---|---|---|---|
| Best Overall | EMBT | EMBARCADERO TECHNOLOGIES INC | 94 |
| Top Technical | CPTV | CAPTIVA SOFTWARE CORP DEL | 48 |
| Top Fundamental | ODFL | OLD DOMINION FGHT LINES INC | 29 |
| Top Tech. & Fund. | ODFL | OLD DOMINION FGHT LINES INC | 29 |
Category |
Symbol |
Company Name |
Expected Gain1 |
|---|---|---|---|
| Best Overall | RADS | RADIANT SYS INC | 56 |
| Top Technical | CTHR | CHARLES & COLVARD LTD | 37 |
| Top Fundamental | ZUMZ | Zumiez, Inc. | 25 |
| Top Tech. & Fund. | ZUMZ | Zumiez, Inc. | 25 |
If you received this newletter from a friend and you would like to receive it regularly please go to the BreakoutWatch.com site and enter as a Guest. You will then be able to register to receive the newsletter.
Copyright © 2005 NBIcharts, LLC dba BreakoutWatch.com. All rights reserved.