| Market Summary | Weekly Breakout Report | Top Breakout Choices | Top 2nd Chances | New Features | Tip of the Week |
Market Summary
The release on Tuesday of the minutes of the December meeting of the Federal Reserve's Open Markets Committee ignited a strong rally that gained further impetus on Friday as new job growth fell well below expectations. It was as if we had been driving with the handbrake on and it was suddenly let off. The markets had wanted to push higher throughout the last two months of last year, but were restrained by fears that the the Fed would continue its policy of raising interest rates to curb inflation. The meeting minutes showed that there was a consensus among committee members that an end to rising interest rates was coming soon, although there was disagreement about exactly when, while the job creation numbers showed that the economy was not in danger of overheating through wage-push inflation. By week's end all the indexes had set new highs not seen since 2001. The DJI rose 2.26%, the NASDAQ jumped 4.55% and the S&P 500 gained nearly 3%. Quite a contrast to the opening week of 2004!
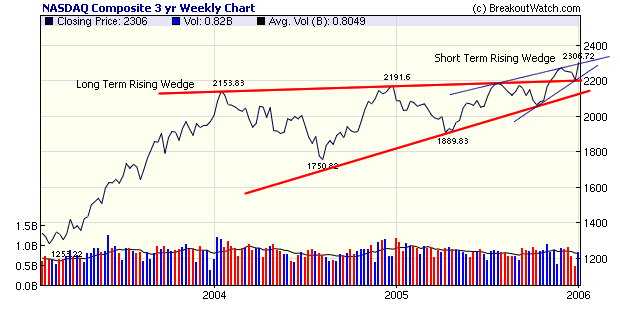
We usually focus on the NASDAQ because that is the market of most interest to CANTATA investors. It is especially worthy of consideration this week in view of out market model signaling a re-entry and the striking gains made. Towards the end of last year we commented on a couple of occasions that the index had broken to the upside of a rising wedge formation which was a bullish signal. In the last week of 2005 we saw a retreat to the top that wedge, but this week the wedge provided a springboard for strong gains as the index tested support. We can now see that a shorter term rising wedge formation has developed. A push through the upside of that wedge from here would be very bullish but given the performance of the NASDAQ this week, we can expect that some short term consolidation will occur, possibly to the lower bound of the wedge, which is around a 2% retracement from here.

There were double the average number of breakout attempts this week with sixty-four being confirmed. These gained an average of 4.58 % by week's end, just beating the performance of the NASDAQ as a whole. These can expected to go on to make bigger gains in the coming weeks, of course, and the average gain by breakouts over the last thirteen weeks is 7.7%. Over the same period the best performing index, the NASDAQ gained just 2.3%, so breakouts outperformed the overall market by more than three fold during the recent rally.
Get a 14 day Trial of our premium 'Platinum' service for just $9.95 and if you subsequently subscribe to any subscription level we will credit your $9.95 to your subscription. 14
Day Platinum Trial |
Our new TradeWatch service went live on January 3.
We introduced a new navigation menu which is easier to use.
Our Sell Assistant, which is part of our new TradeWatch service, can be used to obtain a sell signal on any stock, not just those on our TradeWatch lists. You can also ask for an alert to be sent when our Sell Assistant issues a sell alert for any stock. The Sell Assistant uses our Sell Model which is based on three technical indicators which must be in agreement before a sell signal is issued.
When we first discussed our Sell Model (12/03/05), we described the model as relying on three metrics: Bollinger Band Bands, Parabolic Stop and Reverse and the trend of the On Balance Volume (OBV) indicator. We found that the model gave extremely good results (of the order of 15%) when backtested on our TradeWatch list for all of 2005. When we did further testing however, we found that the model worked less well when used to determine today if the stock should be sold tomorrow. The reason for this was that the OBV trend was calculated after first smoothing the OBV. The smoothing algorithm we used knew the values of the OBV both before and after any point in time but when the algorithm was applied without having the benefit of those future observations, which of course is the real world situation, it gave disappointing results.
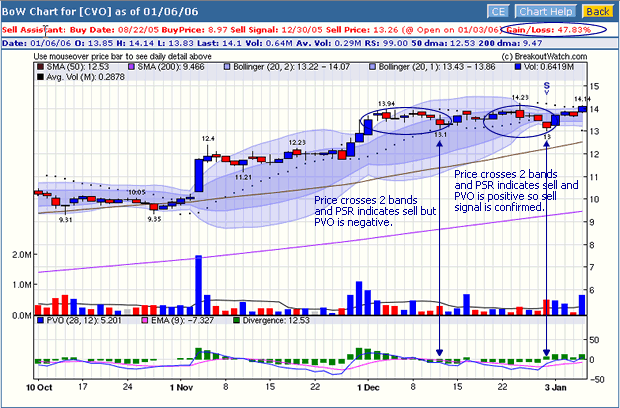
Instead of using the OBV trend as a confirmation signal, we now use the Price-Volume Oscillator. In a significant decline, the oscillator will be positive and so we look for a positive value in the oscillator to confirm the signal from the BB Bands and the PSAR. Here is an example of how the model worked for CVO, a stock on our Best Return list, where it issued a sell signal on 12/30/05 after a gain of 47.8%. If only the model had a crystal ball and knew what the 3rd of January would bring!

For all the stocks on our best return list for 2005 the sell model would have given an average return of 7.3%. This assumes that the stock was sold at the open on the day after the sell signal was issued and is therefore ea very realistic simulation. This is a very good return when you consider that the major indexes were flat for 2005. The Sell Model does not use a sell stop of 8%, but instead relies purely on the combination of the BB, PSAR and PVO to give a sell signal. If one had used a sell stop of 8% below the buy price and sold the day after the stop was triggered, then the return would have been 5.1%. In other words, the sell model gave a 43% better return than using an 8% sell stop. You can see the data behind this analysis in this excel spreadsheet.
The Sell Model will undergo further testing and refinement in the coming weeks. Your support of breakoutwatch.com is greatly appreciated so this research can continue.
Investment Advisors Using our Service
If you would like to be listed here, please contact us. As a service to those who support us, there is no additional charge to be listed here.
TradeRight Securities, located in a suburb of Chicago, is a full services investment management company and broker/dealer. They have been a subscriber, and user, of BreakoutWatch.com for some time now. They practice CANTATA and use Breakoutwatch.com as a “research analyst”. You can learn more about TradeRight Securities at: www.traderightsecurities.com. If you’re interested in speaking to a representative, simply call them toll-free at 1-800-308-3938 or e-mail gdragel@traderightsecurities.com.
Get a 14 day Trial of our premium 'Platinum' service for just $9.95 and if you subsequently subscribe to any subscription level we will credit your $9.95 to your subscription. 14
Day Platinum Trial |
| Index | Value | Change Week | Change YTD | Market1 Signal |
||||||||||||||||||||||||||||||||||||
|---|---|---|---|---|---|---|---|---|---|---|---|---|---|---|---|---|---|---|---|---|---|---|---|---|---|---|---|---|---|---|---|---|---|---|---|---|---|---|---|---|
| Dow | 10959.3 | 2.26% | 2.26% | enter | ||||||||||||||||||||||||||||||||||||
| NASDAQ | 2305.62 | 4.55% | 4.55% | enter | ||||||||||||||||||||||||||||||||||||
| S&P 500 | 1285.45 | 2.98% | 2.98% | enter | ||||||||||||||||||||||||||||||||||||
1The Market Signal is derived from our proprietary
market model. The market model is described on the site. 2The site also shows industry rankings based on fundamentals, combined technical and fundamentals, and on price alone (similar to IBD). The site also shows daily industry movements. |
||||||||||||||||||||||||||||||||||||||||
# of Breakouts
|
Period Average1
|
Max. Gain During Period2
|
Gain at Period Close3
|
|
|---|---|---|---|---|
| This Week | 65 | 31.15 | 5.84% | 4.48% |
| Last Week | 9 | 28.31 | 1.23% | 0.38% |
| 13 Weeks | 466 | 33.08 | 13.4% |
7.78% |
Sector
|
Industry
|
Breakout Count for Week
|
|---|---|---|
Electronics
|
Electr-Semicndtr Mfg
|
5
|
Auto & Truck
|
Auto & Truck-OEM
|
3
|
Real Estate/ REIT
|
Real Estate-REIT
|
3
|
Computer
|
Computer-Networking
|
2
|
Computer Software
|
Comp Software-Enterprise
|
2
|
Diversified Operations
|
Diversified Operations
|
2
|
Oil & Gas
|
Oil & Gas-Mach/Equip
|
2
|
Oil & Gas
|
Oil & Gas-Field Services
|
2
|
Retail
|
Retail-Apparel
|
2
|
Special
|
Special-ClsdEndFunds/Bond
|
2
|
Steel
|
Steel -Producers
|
2
|
Telecomm
|
Telecomm-Equipment
|
2
|
Utility
|
Utility-Electric
|
2
|
Aerospace & Defense
|
Aerospace & Defense-Equip
|
1
|
Banks
|
Banks-Money Center
|
1
|
Chemical
|
Chemical-Fertilizers
|
1
|
Chemical
|
Chemical-Plastics
|
1
|
Computer
|
Computer-Storage Devices
|
1
|
Computer Software
|
Comp Software-Healthcare
|
1
|
Electronics
|
Electr-Semicndtr Equip
|
1
|
Finance
|
Finance-Invest Management
|
1
|
Finance
|
Finance-Brokers
|
1
|
Food
|
Food-Prepared
|
1
|
Healthcare
|
Healthcare-Biomed/Genetic
|
1
|
Healthcare
|
Healthcare-Drugs/Ethical
|
1
|
Healthcare
|
Healthcare-Products
|
1
|
Insurance
|
Insurance-Life
|
1
|
Leisure
|
Leisure-Services
|
1
|
Leisure
|
Leisure-Gaming
|
1
|
Machinery
|
Machinery-Machine Tools
|
1
|
Mining
|
Mining-Gold/Silver/Gems
|
1
|
Mining
|
Mining-Misc Ores
|
1
|
Office
|
Office-Supplies
|
1
|
Oil & Gas
|
Oil & Gas-Drilling
|
1
|
Oil & Gas
|
Oil & Gas-U S Explr/Prod
|
1
|
Oil & Gas
|
Oil & Gas-Prod/Pipeline
|
1
|
Real Estate/ REIT
|
Real Estate Management
|
1
|
Retail
|
Retail-Discount/Variety
|
1
|
Retail
|
Retail-Building Products
|
1
|
Retail
|
Retail-Department Stores
|
1
|
Retail
|
Retail-Misc/Diversified
|
1
|
Retail
|
Retail-Mail Order/Direct
|
1
|
Special
|
Special-Market/Tracking Funds
|
1
|
Steel
|
Steel -Specialty
|
1
|
Transportation
|
Transportation -Airlines
|
1
|
2This represents the return if each stock were bought at its breakout price and sold at its intraday high.
3This represents the return if each stock were bought at its breakout price and sold at the most recent close.
Category |
Symbol |
Company Name |
Expected Gain1 |
|---|---|---|---|
| Best Overall | APLX | APPLIX INC | 102 |
| Top Technical | PTA | PENN TREATY AMERN CORP | 67 |
| Top Fundamental | SWN | SOUTHWESTERN ENERGY CO | 49 |
| Top Tech. & Fund. | SWN | SOUTHWESTERN ENERGY CO | 49 |
Category |
Symbol |
Company Name |
Expected Gain1 |
|---|---|---|---|
| Best Overall | FLOW | FLOW INTL CORP | 66 |
| Top Technical | SHOE | SHOE PAVILION INC | 0 |
| Top Fundamental | STX | SEAGATE TECHNOLOGY | 44 |
| Top Tech. & Fund. | MCRI | MONARCH CASINO & RESORT INC | 0 |
If you received this newletter from a friend and you would like to receive it regularly please go to the BreakoutWatch.com site and enter as a Guest. You will then be able to register to receive the newsletter.
Copyright © 2006 NBIcharts, LLC dba BreakoutWatch.com. All rights reserved.