| Market Summary | Weekly Breakout Report | Top Breakout Choices | Top 2nd Chances | New Features | Tip of the Week |
Market Summary
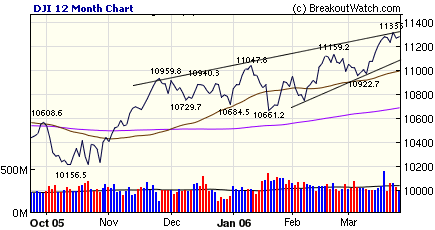
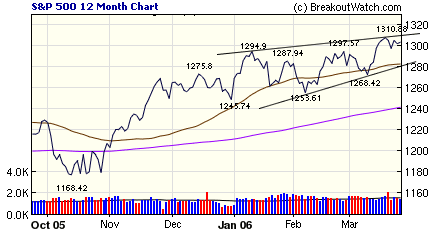
The NASDAQ was the only market to show gains this week as investors continued to receive conflicting signals on the direction of interest rates. An indication that rates would continue to rise was provided by evidence of a strengthening economy as jobless claims fell, sales of existing homes rose and the core inflation rate ticked up. There were also contra-indications, however, as long term rates continued to fall. The Fed's Open Markets Committee meets on Tuesday and another quarter point rise is expected. Any language that implies further increases are expected will have a negative impact on the markets. The DOW closed the week flat after closing at a new 5 year high mid-week and the S&P 500 slipped 0.33%. The NASDAQ Composite gained 0.27%. Volume pulled back from last weeks level indicating a lack of enthusiasm by institutions to place bets in either direction.
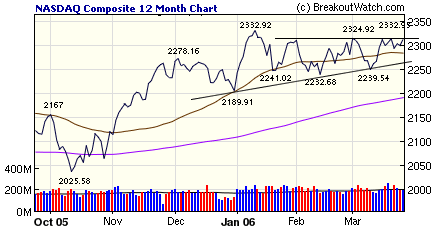
For the year, the DJI is the strongest performer followed by the NASDAQ and then the S&P 500. The DJI and S&P 500 continue to be on a firm upward trend while the NASDAQ is consolidating in an ascending triangle with a horizontal resistance line at 2325.
A breakout above 2325 would be a bullish sign for the NASDAQ.
With so much uncertainty and falling volume, the number of successful breakouts fell to 18 this week with a gain by weeks end of 1.3%. The standout performer was Emisphere Technologies (EMIS ) which closed 19.17% above its pivot. EMIS was also on our TradeWatch 'Buy at Open' and 'Best Return' lists.
Our TradeWatch Best Return list is showing an annualized return of 69% and our new Buy at Open list an annualized return of 79%.
There was a change at the top of our leading industries list this week as Telecom- Fibre Optics took over from Machinery/Construction-Mining.
Get a 14 day Trial of our premium 'Platinum' service for just $9.95 and if you subsequently subscribe to any subscription level we will credit your $9.95 to your subscription. 14
Day Platinum Trial |
The backtest function was enhanced. See below
Fine Tuning Your Filters Using Backtesting
You probably know that you can filter our CwHwatch list but what values should you use? We provide some help with two standard filters called "CAN" and 'BOW' which give you a starting point. The CAN filter is set to values approximating the suggestions in How to Make Money in Stocks by William O'Neil. The 'BOW' filter is much more restrictive and is focused on those technical characteristics of a CwH handle that indicate a possible strong breakout at the next session. To help you adjust the filters to your needs, we provide a 'Backtest' feature that allows you to back test your filters over a time period of up to 12 months. We described how to use this feature in detail in our 8/6/2005 Newsletter.
A limitation of the filter back testing was that it did not provide much help if you wanted to find filters that would meet certain breakout day percentage gain or breakout day volume multiple objectives. An enhancement to the filter back testing now gives you extra help in two ways:
- The filter values that correspond to the % gain and volume objectives are now provided on the backtest results summary
- The filter values for each stock selected by the back test are available when the 'list' link is clicked on the summary page.
Suppose you want to fine tune the BOW filters to select stocks with a breakout day gain of 5%. To do so:
- Click the BOW filter button
- Click the Backtest button
- Enter the number of days you want to backtest over and enter '5' as the minimum breakout day gain. Click Go.
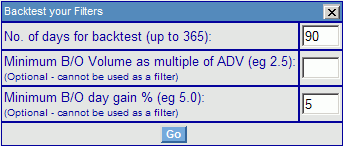
4. The resulting summary screen shows the minimum values of the filters that would have selected all stocks making at least a 5% gain on the day of breakout. This is only displayed when either or both of the breakout day options is selected.

5. To see the stocks corresponding to the selection, click the 'list' link in the No. of Breakouts column.
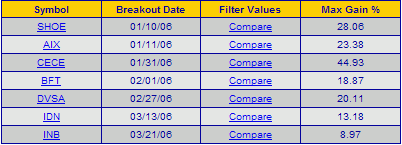
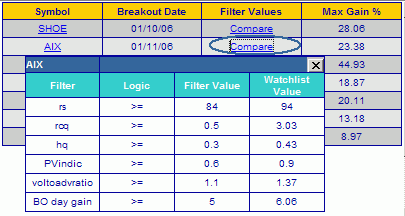
6. To see a T/A chart of the stock, click the symbol, or to see how the filter values compare to the actual metrics for the stock, click a 'Compare' link.
If you think our service has great potential but you are too busy, or find it too complex, you should consider talking to one of the investment advisors listed below who use our service to generate great returns for their clients.
Investment Advisors Using our Service
TradeRight Securities, located in a suburb of Chicago, is a full services investment management company and broker/dealer. They have been a subscriber, and user, of BreakoutWatch.com for some time now. They practice CANTATA and use Breakoutwatch.com as a “research analyst”. You can learn more about TradeRight Securities at: www.traderightsecurities.com. If you’re interested in speaking to a representative, simply call them toll-free at 1-800-308-3938 or e-mail gdragel@traderightsecurities.com.
PivotPoint Advisors, LLC takes a technical approach to investment planning and management. A breakoutwatch.com subscriber since May, 2004, they use breakouts, market signals, and now TradeWatch to enhance returns for their clients. Learn more at http://pivotpointadvisors.net or contact John Norquay at 608-826-0840 or by email at john.norquay@pivotpointadvisors.net.
Note to advisors: If you would like to be listed here, please contact us. As a service to those who subscribe to us, there is no additional charge to be listed here.
Get a 14 day Trial of our premium 'Platinum' service for just $9.95 and if you subsequently subscribe to any subscription level we will credit your $9.95 to your subscription. 14
Day Platinum Trial |
| Index | Value | Change Week | Change YTD | Market1 Signal |
||||||||||||||||||||||||||||||||||||
|---|---|---|---|---|---|---|---|---|---|---|---|---|---|---|---|---|---|---|---|---|---|---|---|---|---|---|---|---|---|---|---|---|---|---|---|---|---|---|---|---|
| Dow | 11280 | 0% | 5.25% | enter | ||||||||||||||||||||||||||||||||||||
| NASDAQ | 2312.82 | 0.27% | 4.87% | enter | ||||||||||||||||||||||||||||||||||||
| S&P 500 | 1302.95 | -0.33% | 4.38% | enter | ||||||||||||||||||||||||||||||||||||
1The Market Signal is derived from our proprietary
market model. The market model is described on the site. 2The site also shows industry rankings based on fundamentals, combined technical and fundamentals, and on price alone (similar to IBD). The site also shows daily industry movements. |
||||||||||||||||||||||||||||||||||||||||
# of Breakouts
|
Period Average1
|
Max. Gain During Period2
|
Gain at Period Close3
|
|
|---|---|---|---|---|
| This Week | 18 | 31.69 | 5% | 1.24% |
| Last Week | 37 | 32.15 | 6.92% | 7.94% |
| 13 Weeks | 466 | 33.54 | 14.37% |
6.1% |
Sector
|
Industry
|
Breakout Count for Week
|
|---|---|---|
Healthcare
|
Healthcare-Drugs/Ethical
|
2
|
Healthcare
|
Healthcare-Products
|
2
|
Oil & Gas
|
Oil & Gas-U S Explr/Prod
|
2
|
Building
|
Building-Maint & Services
|
1
|
Computer
|
Computer-Integrated Sys
|
1
|
Computer Software
|
Comp Software-Enterprise
|
1
|
Finance
|
Finance-Misc Services
|
1
|
Healthcare
|
Healthcare-Med/Dent Services
|
1
|
Insurance
|
Insurance-Diversified
|
1
|
Insurance
|
Insurance-Prop/Casualty/TItl
|
1
|
Internet
|
Internet-ISP/Content
|
1
|
Leisure
|
Leisure-Htls/Mtls
|
1
|
Mining
|
Mining-Gold/Silver/Gems
|
1
|
Oil & Gas
|
Oil & Gas-Prod/Pipeline
|
1
|
Personal
|
Personal -Cosmetics
|
1
|
2This represents the return if each stock were bought at its breakout price and sold at its intraday high.
3This represents the return if each stock were bought at its breakout price and sold at the most recent close.
Category |
Symbol |
Company Name |
Expected Gain1 |
|---|---|---|---|
| Best Overall | SWB | Smith & Wesson Hldg Corp | 101 |
| Top Technical | STXS | Stereotaxis Inc | 38 |
| Top Fundamental | IFIN | Investors Fin Svcs Cp | 22 |
| Top Tech. & Fund. | DBRN | Dress Barn Inc | 28 |
Category |
Symbol |
Company Name |
Expected Gain1 |
|---|---|---|---|
| Best Overall | HOM | Home Solutions Of America | 101 |
| Top Technical | HOM | Home Solutions Of America | 101 |
| Top Fundamental | PRLS | Peerless Systems Corp | 89 |
| Top Tech. & Fund. | PRLS | Peerless Systems Corp | 89 |
If you received this newletter from a friend and you would like to receive it regularly please go to the BreakoutWatch.com site and enter as a Guest. You will then be able to register to receive the newsletter.
Copyright © 2006 NBIcharts, LLC dba BreakoutWatch.com. All rights reserved.