| Market Summary | Weekly Breakout Report | Top Breakout Choices | Top 2nd Chances | New Features | Tip of the Week |
Market Summary
The markets delivered a mixed result in this shortened trading week as trading levels fell in the face of continuing uncertainty about interest rates and as investors kept their powder dry ahead of first quarter earnings results which begin in earnest next week. The few earnings results that have appeared so far portend well but investor enthusiasm for stocks has been dampened by potential inflationary pressures coming from a tightening labor market and increased energy costs, while rising bond yields suck funds from the equities markets. The uncertain geopolitical situation centering around Iran and the middle-east probably also added to the cautious mood. For the week, the DJI rose 0.16%, the NASDAQ Composite lost 0.55% and the S&P 500 gave up 0.49%. After adjusting for the shortened week, volumes were down by about 10%. A pullback on lighter volume is a sign of a well-behaved market following the recent 5 year highs posted by all the indexes.
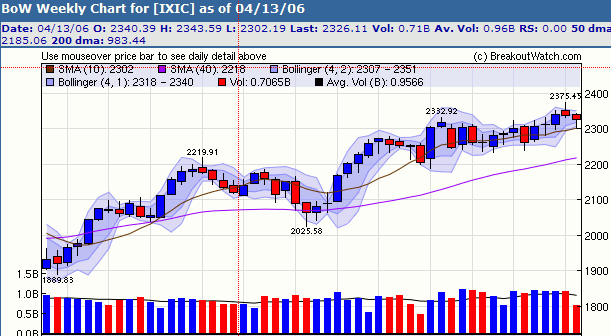
The sharply lower weekly volume for the NASDAQ is clear on the 1 year weekly chart shown below. Note that although the index closed down for the week, it touched its 10 week (50 day) moving average and recovered. Note also that the Bollinger Bands are tightening which is usually a precursor to a breakout, although the breakout direction cannot be determined. I'll hazard a guess that the coming earnings season will exceed expectations while the economy will continue to grow and inflation will be kept in check resulting in a breakout to the upside.

Light volumes kept breakout attempts low for the week and there were just 17 confirmed compared to a thirteen week average of 32. Most closed within the 5% range of their pivot usually considered acceptable for purchase after breakout. Those exceeding that range were BTUI which gained 14.14%, GOL which gained 8% and ARD gained 7.2%.
Get a 14 day Trial of our premium 'Platinum' service for just $9.95 and if you subsequently subscribe to any subscription level we will credit your $9.95 to your subscription. 14
Day Platinum Trial |
The TradeWatch history display was corrected to show the sell price on the day after a recommended sale.
A bug in the Sell Alert processing was corrected which under rare circumstances prevented a timely sell alert from being sent.
Understanding Sell Signals from the Sell Assistant
As a subscriber remarked to me this week, buying is easy but selling is the hard part. That's why we felt our service would not be complete without providing sell assistance and why we have worked so hard at getting a Sell Model that gives good results. We use the Sell Model in two different ways, and confusion can arise if you don't understand the separate uses.
1. The Sell Assistant
The Sell Assistant is designed to determine if you should sell a stock at the close of the last day of trading as of when you use the tool. This can result in the Sell Assistant issuing a sell signal on a particular date but when you use it again with the same information a few days later, the sell signal may have disappeared. This will happen if the latest closing price is higher than the close on the day the original sell alert was issued.
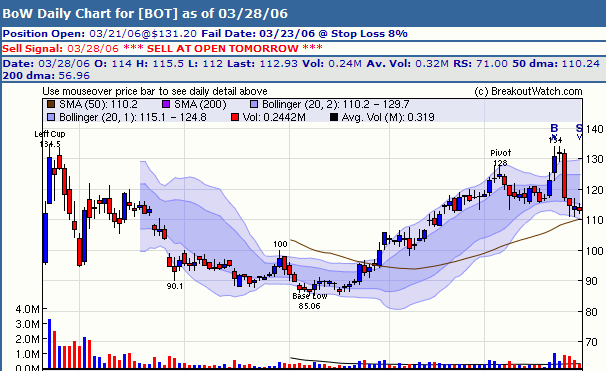
Consider, for example, BOT bought from our TradeWatch Best Return list on 3/21/06 for a price of $131.20. A Sell Alert was issued on 3/28/06 and if you had looked at the Sell Assistant that night you would have seen:

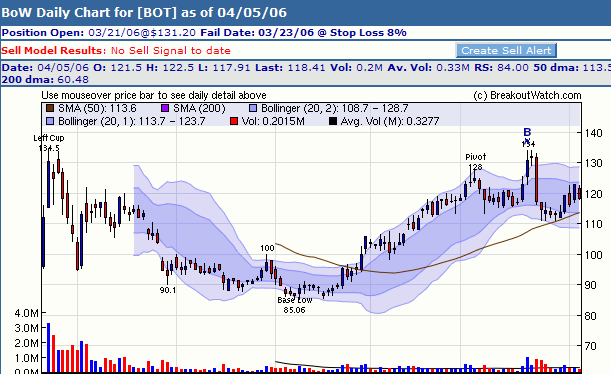
If you had looked a again a few days later, say on 4/5/06, you would have seen that the Sell Signal (indicated by the S) had disappeared:

The reason for the apparent discrepancy is that the price had moved higher since the original sell alert was issued and so the earlier sell signal is ignored.
2. TradeWatch History
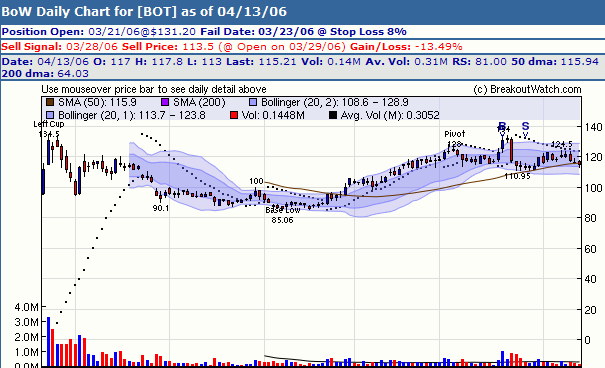
When you look at the TradeWatch history, we report the gain/loss based on when the first sell signal was issued by the sell model . We show that on the chart you obtain when clicking on symbol in the history list. So for BOT from the TradeWatch History you will see:

Conclusion
The Sell Assistant always tries to determine if you should sell the stock at the next open and ignores any previous sell signal it might have issued. When viewing the history of any stock on our TradeWatch lists, the first sell signal is shown to represent the results you might have obtained if you had traded the stock according to our methodology.
Another Bug Mea Culpa
While preparing this article, I discovered a bug that prevented sell alerts being issued under certain circumstances. The small number of tradeWatch subscribers affected by this bug have been notified.
If you think our service has great potential but you are too busy, or find it too complex, you should consider talking to one of the investment advisors listed below who use our service to generate great returns for their clients.
Investment Advisors Using our Service
TradeRight Securities, located in a suburb of Chicago, is a full services investment management company and broker/dealer. They have been a subscriber, and user, of BreakoutWatch.com for some time now. They practice CANTATA and use Breakoutwatch.com as a “research analyst”. You can learn more about TradeRight Securities at: www.traderightsecurities.com. If you’re interested in speaking to a representative, simply call them toll-free at 1-800-308-3938 or e-mail gdragel@traderightsecurities.com.
PivotPoint Advisors, LLC takes a technical approach to investment planning and management. A breakoutwatch.com subscriber since May, 2004, they use breakouts, market signals, and now TradeWatch to enhance returns for their clients. Learn more at http://pivotpointadvisors.net or contact John Norquay at 608-826-0840 or by email at john.norquay@pivotpointadvisors.net.
Note to advisors: If you would like to be listed here, please contact us. As a service to those who subscribe to us, there is no additional charge to be listed here.
Get a 14 day Trial of our premium 'Platinum' service for just $9.95 and if you subsequently subscribe to any subscription level we will credit your $9.95 to your subscription. 14
Day Platinum Trial |
| Index | Value | Change Week | Change YTD | Market1 Signal |
||||||||||||||||||||||||||||||||||||
|---|---|---|---|---|---|---|---|---|---|---|---|---|---|---|---|---|---|---|---|---|---|---|---|---|---|---|---|---|---|---|---|---|---|---|---|---|---|---|---|---|
| Dow | 11137.7 | 0.16% | 3.92% | enter | ||||||||||||||||||||||||||||||||||||
| NASDAQ | 2326.11 | -0.55% | 5.48% | enter | ||||||||||||||||||||||||||||||||||||
| S&P 500 | 1289.12 | -0.49% | 3.27% | enter | ||||||||||||||||||||||||||||||||||||
1The Market Signal is derived from our proprietary
market model. The market model is described on the site. 2The site also shows industry rankings based on fundamentals, combined technical and fundamentals, and on price alone (similar to IBD). The site also shows daily industry movements. |
||||||||||||||||||||||||||||||||||||||||
# of Breakouts
|
Period Average1
|
Max. Gain During Period2
|
Gain at Period Close3
|
|
|---|---|---|---|---|
| This Week | 17 | 29.23 | 3.15% | 0.91% |
| Last Week | 24 | 31.62 | 8.06% | 3.14% |
| 13 Weeks | 437 | 32.54 | 13.77% |
4.25% |
Sector
|
Industry
|
Breakout Count for Week
|
|---|---|---|
Business Services
|
Business Svcs-Misc
|
2
|
Electronics
|
Electr-Semicndtr Equip
|
2
|
Real Estate/ REIT
|
Real Estate-REIT
|
2
|
Special
|
Special-ClsdEndFunds/Bond
|
2
|
Building
|
Building-Heavy Constr
|
1
|
Computer Software
|
Comp Software-Desktop
|
1
|
Finance
|
Finance-Misc Services
|
1
|
Healthcare
|
Healthcare-Biomed/Genetic
|
1
|
Oil & Gas
|
Oil & Gas-Refining/Mktg
|
1
|
Oil & Gas
|
Oil & Gas-U S Explr/Prod
|
1
|
Oil & Gas
|
Oil & Gas-Mach/Equip
|
1
|
Transportation
|
Transportation -Airlines
|
1
|
Utility
|
Utility-Electric
|
1
|
2This represents the return if each stock were bought at its breakout price and sold at its intraday high.
3This represents the return if each stock were bought at its breakout price and sold at the most recent close.
Category |
Symbol |
Company Name |
Expected Gain1 |
|---|---|---|---|
| Best Overall | SWB | Smith & Wesson Hldg Corp | 99 |
| Top Technical | THS | TreeHouse Foods Inc | 22 |
| Top Fundamental | FCL | Foundation Coal Holdings | 39 |
| Top Tech. & Fund. | GI | Giant Industries Inc | 33 |
Category |
Symbol |
Company Name |
Expected Gain1 |
|---|---|---|---|
| Best Overall | STRL | Sterling Construction Comp Inc | 60 |
| Top Technical | STRL | Sterling Construction Comp Inc | 60 |
| Top Fundamental | ALJ | Alon USA Energy Inc | 44 |
| Top Tech. & Fund. | ALJ | Alon USA Energy Inc | 44 |
If you received this newletter from a friend and you would like to receive it regularly please go to the BreakoutWatch.com site and enter as a Guest. You will then be able to register to receive the newsletter.
Copyright © 2006 NBIcharts, LLC dba BreakoutWatch.com. All rights reserved.