| Market Summary | Weekly Breakout Report | Top Breakout Choices | Top 2nd Chances | New Features | Tip of the Week |
Important new tool simulates realistic Tradewatch portfolio performance. See below.
Market Summary
The week began with optimism that interest rates were on hold and that the economy was slowing, but not so fast as to threaten a recession. Blue skies seemed ahead as oil prices were falling and a large oil find in the Gulf of Mexico promised to further relieve upward price pressure, but in the distant future. This sunny prospect took a more overcast look on Wednesday when higher than expected wage rises were reported, which could lead to price inflation if passed on to the consumer, and the Fed's 'beige book' showed economic activity falling. Profit warnings and inventory increases by large homebuilders added to the concern because a severe slump in home prices will curb consumer optimism and spending. Nervous investors were further alarmed by a statement from a Federal Reserve regional President which implied rate increases may not be over. These events brought two distribution days followed by a light volume recovery on Friday which was insufficient to offset the week's losses. The DJI lost 0.63%, the NASDAQ Composite, which had been the biggest gainer of late turned in the biggest loss of 1.25% and the S&P 500 gave up 0.92%. In this shortened week, volume overall was even lower than the prior week, so although this was a pullback, it was a minor correction when viewed against the gains of the last several weeks.
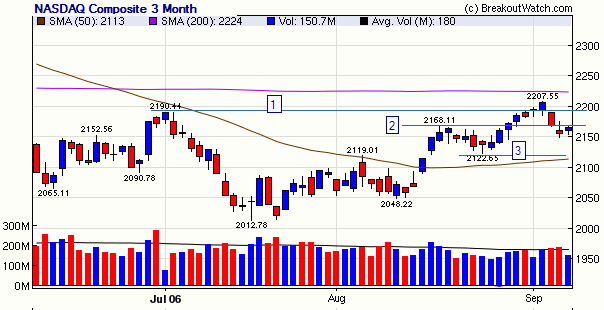
As usual, we focus now on the NASDAQ Composite which looked as though it may break through its 200 day moving average this week and reverse our market signal. The NASDAQ broke through prior resistance [1] on Monday and fell to secondary support [2] on Wednesday. This was not sustained and Friday saw it unable to break through the former support line [2] which was now resistance. To again attack the 200day moving average level, the index must now break through two resistance lines. A breakthrough of [2] would be a minor bullish signal and a breakthrough of [1] more convincing. Our model will remain at exit though until the 200dma is overcome. On the downside, a break through 2122 [3] would be bearish, especially if the 50 dma just below is broken.

There were no new features added this week.
Simulated Tradewatch Portfolio Returns
A subscriber asked what the return on our Tradewatch Buy at Open strategy would be if you invested $10k in each position. There is no easy answer, as it depends on when you invest and how many positions your investment strategy allows you to hold at the same time. The only way to answer the question meaningfully was to build a tool which allows the backtesting of portfolio returns against realistic assumptions and time periods. We're pleased to make that tool available to Tradewatch subscribers now. It is available under the Tradewatch History menu choice.
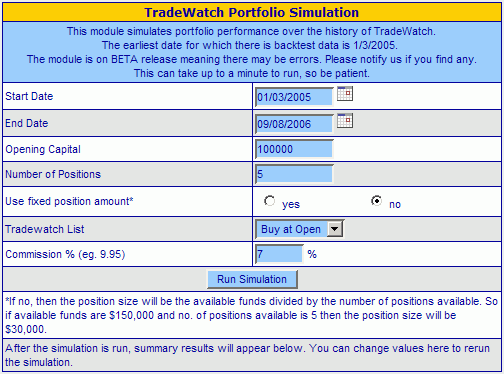
Choosing Tradewatch History > Backtest presents you with the following screen:

The screen is mostly self explanatory, although the fixed position amount option may need some elaboration. If you choose a fixed position amount, then every position will be bought using the 1/nth of the initial portfolio size, where n is the number of positions. If not, then the position size will be calculated by dividing the portfolio cash balance by the number of available positions. If you sell at a profit, then your available cash increases and your next position size will be increased. Conversely, if you sell at a loss, your available cash is depleted and your next position size will be smaller.
Clicking the 'Run Simulation' causes the system to simulate buy and sell orders according to the history of Tradewatch listed stocks. Buys are made sequentially from the start date and sales are made as suggested by the Sell Assistant default behavior without stop loss or trailing stop options. Commission is calculated on each trade using the % you supply.
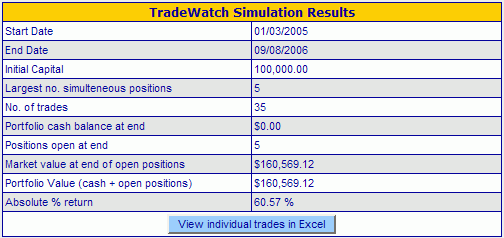
Running the default simulation as shown above provides the following result. It can take a little while depending on the length of the period being simulated, so be patient.

Clicking the 'View individual trades in Excel' button will open up an Excel spreadsheet of the actual trades that were simulated including those that not bought because of the portfolio size limitation.
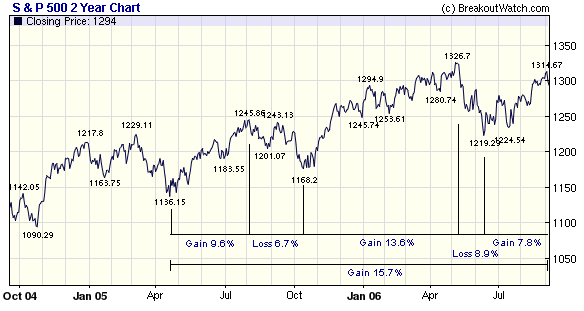
The simulation tool allows you to experiment with different number of positions in your portfolio and over different periods. For example, we can compare a Tradewatch portfolio against the S&P 500 over the last 18 months during periods of rally and correction.

Now we can compare a Tradewatch portfolio to the S&P 500 using both the Buy at Open and Best Return strategies. We'll use position limits of 8 and 4 which are within the range usually recommended. We get some interesting results.
| Portfolio Simulation | S&P 500 | Tradewatch | |
|---|---|---|---|
| Buy at Open | Best Return | ||
| Using 8 positions | |||
| 4/20/05 - 7/29/05 | 9.6% | 19.2% | 16.6% |
| 7/29/05 - 10/13/05 | -6.7% | 3.1% | 2.6% |
| 10/13/05 - 5/8/06 | 13.6% | 40.6% | 24.2% |
| 5/8/06 - 6/14/06 | -8.9% | -0.7% | -2.8% |
| 6/14/06 - 9/5/06 | 7.8% | -3.8% | -1.5% |
| Overall (4/20/05 - 9/5/06) | 15.7% | 50.6% | 56.8% |
| Using 4 positions | |||
| 4/20/05 - 7/29/05 | 9.6% | 14.6% | 26.7% |
| 7/29/05 - 10/13/05 | -6.7% | 10.2% | -0.7% |
| 10/13/05 - 5/8/06 | 13.6% | 54.7% | 50.4% |
| 5/8/06 - 6/14/06 | -8.9% | -1.4% | -5.6% |
| 6/14/06 - 9/5/06 | 7.8% | -8.9% | -2.7% |
| Overall (4/20/05 - 9/5/06) | 15.7% | 62.5% | 94.9% |
The overall results beat the sum of the individual periods, because the sequence of buys and sells is different. Buying into a downturn produces losses, but not as severe as the overall market. Although the two strategies easily beat the S&P overall, it is interesting that they under-performed during the most recent rally. I don't have an explanation for that, except that our market signal said to stay in cash and that position is reflected in the Sell Assistant's daily recommendation. It is also interesting that a 4 position limit beats an 8 position limit. This may be because the first ones to be bought during a rally, outperform those that come later.
I can't emphasize too much that these are very realistic returns and are based on a wholly mechanical, reproducible system that requires little or no thought on the part of the tradewatch subscriber, other than to place buy and sell orders for execution the next day according to the stop and limit instructions given through Tradewatch.
Let me know what you think of this tool and how to improve it.
Investment Advisors Using our Service
TradeRight Securities, located in a suburb of Chicago, is a full services investment management company and broker/dealer. They have been a subscriber, and user, of BreakoutWatch.com for some time now. They practice CANTATA and use Breakoutwatch.com as a “research analyst”. You can learn more about TradeRight Securities at: www.traderightsecurities.com. If you’re interested in speaking to a representative, simply call them toll-free at 1-800-308-3938 or e-mail gdragel@traderightsecurities.com.
PivotPoint Advisors, LLC takes a technical approach to investment planning and management. A breakoutwatch.com subscriber since May, 2004, they use breakouts, market signals, and now TradeWatch to enhance returns for their clients. Learn more at http://pivotpointadvisors.net or contact John Norquay at 608-826-0840 or by email at john.norquay@pivotpointadvisors.net.
Note to advisors: If you would like to be listed here, please contact us. As a service to those who subscribe to us, there is no additional charge to be listed here.
| Get a 14 day Trial of
our premium 'Platinum' service and TradeWatch for just $9.95 and
if you subsequently subscribe to any subscription
level we will credit your $9.95 to your subscription.
14
Day Platinum Trial |
| Index | Value | Change Week | Change YTD | Market1 Signal |
||||||||||||||||||||||||||||||||||||
|---|---|---|---|---|---|---|---|---|---|---|---|---|---|---|---|---|---|---|---|---|---|---|---|---|---|---|---|---|---|---|---|---|---|---|---|---|---|---|---|---|
| Dow | 11392.1 | -0.63% | 6.29% | enter | ||||||||||||||||||||||||||||||||||||
| NASDAQ | 2165.79 | -1.25% | -1.79% | exit | ||||||||||||||||||||||||||||||||||||
| S&P 500 | 1298.92 | -0.92% | 4.06% | enter | ||||||||||||||||||||||||||||||||||||
1The Market Signal is derived from our proprietary
market model. The market model is described on the site. 2The site also shows industry rankings based on fundamentals, combined technical and fundamentals, and on price alone (similar to IBD). The site also shows daily industry movements. |
||||||||||||||||||||||||||||||||||||||||
# of Breakouts
|
Period Average1
|
Max. Gain During Period2
|
Gain at Period Close3
|
|
|---|---|---|---|---|
| This Week | 28 | 23.85 | 3.52% | -0.8% |
| Last Week | 43 | 22.62 | 7.64% | 0.56% |
| 13 Weeks | 337 | 24.62 | 9% |
1.75% |
Sector
|
Industry
|
Breakout Count for Week
|
|---|---|---|
Healthcare
|
Healthcare-Outpnt/HmCare
|
2
|
Oil & Gas
|
Oil & Gas-U S Explr/Prod
|
2
|
Oil & Gas
|
Oil & Gas-Mach/Equip
|
2
|
Computer Software
|
Comp Software-Security
|
1
|
Computer Software
|
Comp Software-Enterprise
|
1
|
Diversified Operations
|
Diversified Operations
|
1
|
Electronics
|
Electr-Semicndtr Equip
|
1
|
Electronics
|
Electr-Semicndtr Mfg
|
1
|
Healthcare
|
Healthcare-Products
|
1
|
Healthcare
|
Healthcare-Drugs/Ethical
|
1
|
Insurance
|
Insurance-Prop/Casualty/TItl
|
1
|
Internet
|
Internet-Secur/Network Svcs
|
1
|
Internet
|
Internet-Software
|
1
|
Internet
|
Internet-ISP/Content
|
1
|
Leisure
|
Leisure-Gaming
|
1
|
Media
|
Media-Cable/Satellite TV
|
1
|
Mining
|
Mining-Gold/Silver/Gems
|
1
|
Oil & Gas
|
Oil & Gas-Refining/Mktg
|
1
|
Oil & Gas
|
Oil & Gas-Field Services
|
1
|
Retail
|
Retail-Restaurant
|
1
|
Retail
|
Retail-Computers/Mobile
|
1
|
Steel
|
Steel -Producers
|
1
|
Telecomm
|
Telecomm-Services Fgn
|
1
|
Utility
|
Utility-Electric
|
1
|
2This represents the return if each stock were bought at its breakout price and sold at its intraday high.
3This represents the return if each stock were bought at its breakout price and sold at the most recent close.
Category |
Symbol |
Company Name |
Expected Gain1 |
|---|---|---|---|
| Best Overall | HL | Hecla Mining Co | 112 |
| Top Technical | VRTB | Vestin Realty Mortgage II Inc | 91 |
| Top Fundamental | FCFS | First Cash Financial Svc | 57 |
| Top Tech. & Fund. | CWTR | Coldwater Creek Inc | 45 |
Category |
Symbol |
Company Name |
Expected Gain1 |
|---|---|---|---|
| Best Overall | SNTS | Santarus Inc | 89 |
| Top Technical | PCCC | Pc Connection Inc | 72 |
| Top Fundamental | PSYS | Psychiatric Solutions Inc | 40 |
| Top Tech. & Fund. | DRIV | Digital River Inc | 0 |
If you received this newletter from a friend and you would like to receive it regularly please go to the BreakoutWatch.com site and enter as a Guest. You will then be able to register to receive the newsletter.
Copyright © 2006 NBIcharts, LLC dba BreakoutWatch.com. All rights reserved.
" BreakoutWatch," the BreakoutWatch.com "eye" logo, and the slogan "tomorrow's breakouts today" are service marks of NBIcharts LLC. All other marks are the property of their respective owners, and are used for descriptive purposes only.