| Market Summary | Weekly Breakout Report | Top Breakout Choices | Top 2nd Chances | New Features | Tip of the Week |
Marketing Help Needed
We are interested in taking to persons with marketing experience who would be interested in assisting us promote the TradeWatch service. We think the returns delivered by a portfolio of TradeWatch stocks (74% y-t-d) are outstanding and worthy of communication to a broader audience. Please email us if you think you can help.
Market Summary
The bulls were delivered a dose of reality on Friday as the Commerce Department reported that third-quarter growth had slowed to its lowest rate in three and a half years and at 1.6% was well below the expected 2% growth rate. A close reading showed that the housing market accounted for most of the drop and other areas, such as consumer spending and business investment actually expanded. This was not sufficient to prevent anxiety building, however, and the DJI and S&P 500 suffered their first losing day of the week. For several years homeowners have been cashing in the increased asset value of their homes through refinancing and many economists believe this has been the engine that has driven the markets higher. Some fear that with that engine sputtering, a recession will follow. This concern is in contrast with the statement issued by the Federal Reserve's open Markets Committee on Wednesday when they said the economy "seems likely to expand at a moderate pace".
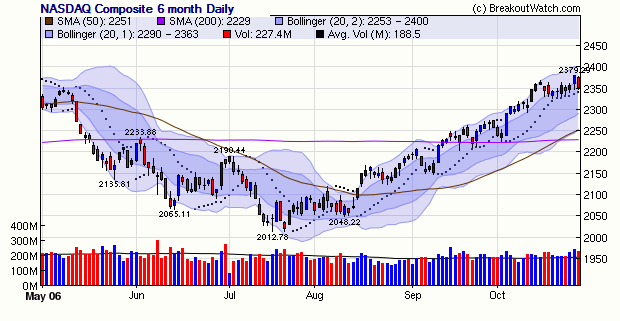
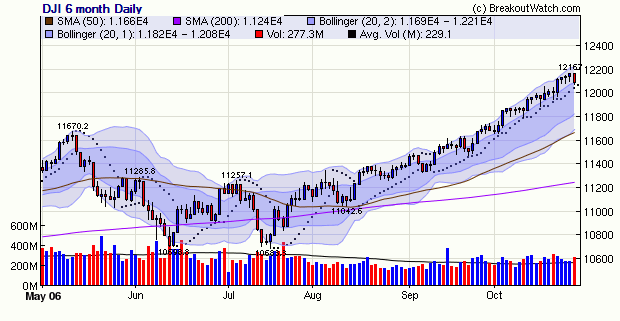
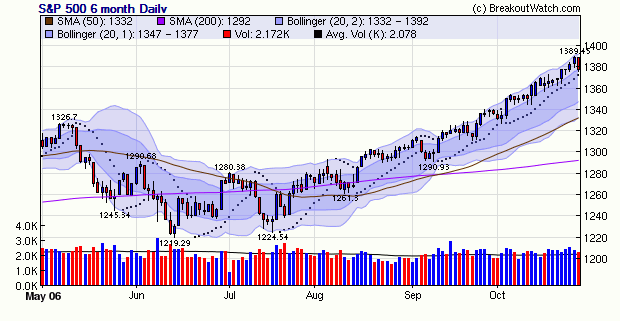
For the week the DJI gained 0.73%, the S&P 500 added 0.64% while the NASDAQ Composite which came under distribution on Tuesday and fell again on Friday managed only a 0.36% gain. On Friday stocks closed near their lows of the day so there is the potential for the sell-off to continue on Monday. This tendency could be halted if inflation data, due before the market opens on Monday, shows a continuing decline and corporate earnings continue to deliver better than expected results. Other data likely to influence the market's mood next week are the index of Midwest business activity on Tuesday; the Institute for Supply Management's manufacturing survey on Wednesday, and the ISM's survey on the services, or non-manufacturing, sector on Friday.
The NASDAQ Composite closed at a new 5 year high on Thursday, but closed below its April, 2005 high on Friday. The NASDAQ is lagging behind the larger cap indexes as it has consolidated over the last two weeks (see charts below) while the DJI and S&P 500 continue to trade within their upper 1 and 2 standard deviation Bollinger Bands. While market growth since July has been strong we don't yet see signs that optimism has become overly exuberant. Considering the gains made over the last few months, Friday's retreat is not surprising and may be healthy for the markets if it is constrained to a consolidation rather than a correction.


The number of successful breakouts almost doubled this week to 90. The average gain to week's end was 1.67%, once again easily beating the major indexes. There were some outstanding gains such as Netgear (NTGR) which gained 16.84% after breakout from a cup-with-handle base and Lodgenet (LNET) which also broke out from a cup-with-handle pattern and gained 15.11%. In all, 16 breakouts gained more than 5%.
| Get a 14 day Trial of our premium 'Platinum'
service and TradeWatch for just $9.95 and if you subsequently subscribe
to any subscription level we will credit your $9.95 to your subscription.
14
Day Platinum Trial |
Change to minimum RS rank requirement for cup-with-handle and basewatch selection
In view of the unmanageably large number of stocks that are appearing on these lists we have increased the minimum RS rank requirement for these lists as follows:
CwHWatch: minimum RS rank to qualify raised from 70 to 80
Basewatch: minimum RS rank to qualify raised from 60 to 70.
New Industry Grouping structure
Our new structure will go into affect on Wednesday.
How to understand and use Email Alerts
A question from a subscriber this week showed that there was some misunderstanding about when we send a breakout email alert so we take up the topic here in case the misunderstanding is more widespread.
We send breakout alerts based on stocks on our cup-with-handle, double bottom, flat base and head and shoulder bottom patterns. We send an alert when the projected volume for the day will exceed 1.5 times the average daily volume and the breakout price has been reached. The projected volume is calculated using a straight line projection. For example, if the volume is 100k after 1 hour of trading, then the projected volume will be 6.5 x 100K (the market is open for 6.5 hours).
The purpose of the email is to give a heads up to subscribers that a breakout may be in process, the email does not mean that a breakout has occurred. We call these breakout attempts and at the end of the session there can be one of four outcomes.
- The price will stay above the breakout price (BoP) and the final volume will be at least 1.5 times the daily average. This is a confirmed breakout
- The volume target is met but the closing price will be below the BoP. This breakout failed on price.
- The volume target was not met but the price close above the BoP. This breakout failed on volume.
- The breakout can fail on both price and volume.
If you bought on an alert and the breakout was confirmed, then you can congratulate yourself on making a smart move. However, only about 50% of alerts are confirmed, so what should you do if the breakout fails. We looked into this question back in January and published some advice in the newsletter of January 14, "Should You Sell an Unconfirmed Breakout?". Our conclusion was that 62% of failed breakout attempts went on to gain at least 5% over the breakout price, with the best outcome being for those that failed on volume. Sometimes it takes a couple of days or more for the volume to build and we call these 'stealth' breakouts because institutions often accumulate stock over a few days so as not to create a breakout situation. We found that 71% of breakouts that fail on volume go on to at least 5% over their BoP.
On Thursday of this week, there were forty-five breakout alerts. For Gold subscribers who do not have access to filters or personal watchlists, on days like that it is essential that you have created your own paper watchlist of stocks that you would be interested in if they start to breakout. There just isn't enough time to do the due diligence as the alerts hit. You can be guided by some of the work we've published in the newsletter such as the 11/12/2005 issue.
To limit the number of email alerts you receive, Filters and Personal Watchlists are available to Platinum subscribers and allow you to ensure you only get alerts on stocks that meet your personal criteria. This can save you hours of time.
Investment Advisors Using our Service
TradeRight Securities, located in a suburb of Chicago, is a full services investment management company and broker/dealer. They have been a subscriber, and user, of BreakoutWatch.com for some time now. They practice CANTATA and use Breakoutwatch.com as a “research analyst”. You can learn more about TradeRight Securities at: www.traderightsecurities.com. If you’re interested in speaking to a representative, simply call them toll-free at 1-800-308-3938 or e-mail gdragel@traderightsecurities.com.
PivotPoint Advisors, LLC takes a technical approach to investment planning and management. A breakoutwatch.com subscriber since May, 2004, they use breakouts, market signals, and now TradeWatch to enhance returns for their clients. Learn more at http://pivotpointadvisors.net or contact John Norquay at 608-826-0840 or by email at john.norquay@pivotpointadvisors.net.
Note to advisors: If you would like to be listed here, please contact us. As a service to those who subscribe to us, there is no additional charge to be listed here.
| Get a 14 day Trial of
our premium 'Platinum' service and TradeWatch for just $9.95 and
if you subsequently subscribe to any subscription
level we will credit your $9.95 to your subscription.
14
Day Platinum Trial |
| Index | Value | Change Week | Change YTD | Market1 Signal |
||||||||||||||||||||||||||||||||||||
|---|---|---|---|---|---|---|---|---|---|---|---|---|---|---|---|---|---|---|---|---|---|---|---|---|---|---|---|---|---|---|---|---|---|---|---|---|---|---|---|---|
| Dow | 12090.3 | 0.73% | 12.81% | enter | ||||||||||||||||||||||||||||||||||||
| NASDAQ | 2350.62 | 0.36% | 6.59% | enter | ||||||||||||||||||||||||||||||||||||
| S&P 500 | 1377.34 | 0.64% | 10.34% | enter | ||||||||||||||||||||||||||||||||||||
1The Market Signal is derived from our proprietary
market model. The market model is described on the site. 2The site also shows industry rankings based on fundamentals, combined technical and fundamentals, and on price alone (similar to IBD). The site also shows daily industry movements. |
||||||||||||||||||||||||||||||||||||||||
# of Breakouts
|
Period Average1
|
Max. Gain During Period2
|
Gain at Period Close3
|
|
|---|---|---|---|---|
| This Week | 90 | 43.85 | 5.09% | 1.67% |
| Last Week | 46 | 40.31 | 6.06% | 1.55% |
| 13 Weeks | 595 | 46.77 | 10.74% |
4.51% |
Sector
|
Industry
|
Breakout Count for Week
|
|---|---|---|
Banks
|
Banks-Southeast
|
4
|
Media
|
Media-Cable/Satellite TV
|
4
|
Steel
|
Steel -Producers
|
4
|
Banks
|
Banks-West/Southwest
|
3
|
Chemical
|
Chemical-Fertilizers
|
3
|
Healthcare
|
Healthcare-Products
|
3
|
Real Estate/ REIT
|
Real Estate-REIT
|
3
|
Telecomm
|
Telecomm-Wireless Services
|
3
|
Aerospace & Defense
|
Aerospace & Defense-Equip
|
2
|
Computer
|
Computer-Networking
|
2
|
Computer Software
|
Comp Software-Financial
|
2
|
Electronics
|
Electr-Measuring Instruments
|
2
|
Electronics
|
Electr-Semicndtr Mfg
|
2
|
Finance
|
Finance-Brokers
|
2
|
Finance
|
Finance-Invest Management
|
2
|
Healthcare
|
Healthcare-HMO
|
2
|
Healthcare
|
Healthcare-Biomed/Genetic
|
2
|
Insurance
|
Insurance-Prop/Casualty/TItl
|
2
|
Internet
|
Internet-ISP/Content
|
2
|
Metal Prds
|
Metal Prds-Pipe/Fab/Misc
|
2
|
Retail
|
Retail-Apparel
|
2
|
Telecomm
|
Telecomm-Services Fgn
|
2
|
Aerospace & Defense
|
Aerospace & Defense-Electr
|
1
|
Auto & Truck
|
Auto & Truck-US & Fgn Mfg
|
1
|
Auto & Truck
|
Auto & Truck-Repl Prts
|
1
|
Banks
|
Banks-Foreign
|
1
|
Building
|
Building-Products/Misc
|
1
|
Computer
|
Computer-Peripheral Equip
|
1
|
Computer Software
|
Comp Software-Enterprise
|
1
|
Computer Software
|
Comp Software-Security
|
1
|
Diversified Operations
|
Diversified Operations
|
1
|
Electronics
|
Electr-Misc Products
|
1
|
Finance
|
Finance-Misc Services
|
1
|
Finance
|
Finance-Savings&Loan
|
1
|
Food
|
Food-Dairy Products
|
1
|
Healthcare
|
Healthcare-Instruments
|
1
|
Healthcare
|
Healthcare-Outpnt/HmCare
|
1
|
Healthcare
|
Healthcare-Drugs/Ethical
|
1
|
Insurance
|
Insurance-Brokers
|
1
|
Leisure
|
Leisure-Services
|
1
|
Leisure
|
Leisure-Toys/Games
|
1
|
Machinery
|
Machinery-Industrial
|
1
|
Machinery
|
Machinery-Machine Tools
|
1
|
Office
|
Office-Equip/Automation
|
1
|
Office
|
Office-Supplies
|
1
|
Oil & Gas
|
Oil & Gas-Mach/Equip
|
1
|
Paper
|
Paper
|
1
|
Personal
|
Personal-Tobacco
|
1
|
Personal
|
Personal-Shoes
|
1
|
Real Estate/ REIT
|
Real Estate Management
|
1
|
Retail
|
Retail-Misc/Diversified
|
1
|
Retail
|
Retail-Restaurant
|
1
|
Telecomm
|
Telecomm-Services US
|
1
|
Textile
|
Textile-Apparel Mfg
|
1
|
Transportation
|
Transportation-Rail
|
1
|
Transportation
|
Transportation-Services
|
1
|
Transportation
|
Transportation -Airlines
|
1
|
2This represents the return if each stock were bought at its breakout price and sold at its intraday high.
3This represents the return if each stock were bought at its breakout price and sold at the most recent close.
Category |
Symbol |
Company Name |
Expected Gain1 |
|---|---|---|---|
| Best Overall | PRXI | Premier Exhibitions Inc | 109 |
| Top Technical | CWTR | Coldwater Creek Inc | 40 |
| Top Fundamental | CWTR | Coldwater Creek Inc | 40 |
| Top Tech. & Fund. | CWTR | Coldwater Creek Inc | 40 |
Category |
Symbol |
Company Name |
Expected Gain1 |
|---|---|---|---|
| Best Overall | BVX | Bovie Medical Systems | 92 |
| Top Technical | QDEL | Quidel Corp | 48 |
| Top Fundamental | ISE | International Securities Excha | 32 |
| Top Tech. & Fund. | ISE | International Securities Excha | 32 |
If you received this newletter from a friend and you would like to receive it regularly please go to the BreakoutWatch.com site and enter as a Guest. You will then be able to register to receive the newsletter.
Copyright © 2006 NBIcharts, LLC dba BreakoutWatch.com. All rights reserved.
" BreakoutWatch," the BreakoutWatch.com "eye" logo, and the slogan "tomorrow's breakouts today" are service marks of NBIcharts LLC. All other marks are the property of their respective owners, and are used for descriptive purposes only.