| Market Summary | Weekly Breakout Report | Top Breakout Choices | Top 2nd Chances | New Features | Tip of the Week |
Market Summary
This was a volatile week for the equities markets which made wide swings on Wednesday and Thursday as investors grappled with generally satisfactory earnings reports but mixed earnings forecasts, a continued slump in existing home sales, but a surprising pick-up in new home sales, rising oil prices, an economy that is stronger than expected and a Fed Futures market that has changed its view on when an interest rate cut is likely. The three major indexes lost ground but remain just positive for the year to date (see summary statistics below).
The economy is not slowing as expected, perhaps partly due to falling gas prices, which acts as an economic stimulus like a tax cut, continued full employment and strong wage growth. Durable goods orders rose in December, even after removing Boeing's aircraft sales, which indicates factories are likely to be busy meeting these orders in the near future. This implies the expansion could continue, raising the possibility that the Fed is more likely to raise interest rates than lower them. The Federal Reserve Open Markets Committee (FOMC) meets next week and their press release, due Wednesday at 2:15, will be interesting for how it deals with the changed economic outlook. Recently, the FOMC has said that a slowing economy was likely to bring inflation down and they have opted to keep rates steady. Now, with the economy not slowing as expected, and inflation remaining well above their target range, they are likely to be more hawkish. The expectation is that they will keep rates unchanged, for now, but the hoped for interest rate cut, that has kept shares prices high, is now a discounted. In fact, the Fed Futures market puts the chance of a rate cut at less than 10% by July and not an even bet until December.
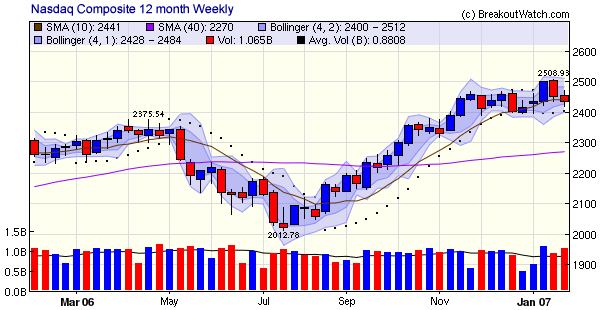
When the markets have a volatile week such as this last one, it is instructive to look at a weekly chart which smooths out the 'noise'. The NASDAQ weekly chart shows volume increased this week and the lower close indicates that the index is under distribution which is consistent with our market signal remaining at 'exit'. Note also that the 50 day moving average has provided support over the last 5 weeks, but failed to do so this week.

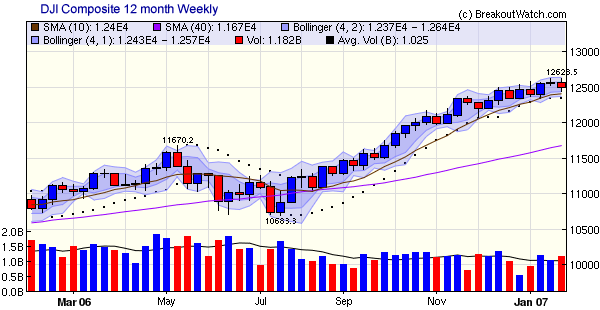
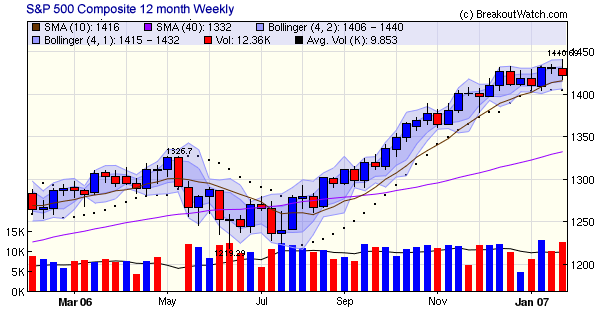
The weekly charts for the DJI and S&P 500 also show distribution. While they remain above their 50 day moving averages, it appears that each could test support at that level soon. Overall, we feel very comfortable with our current market 'exit' signal.
 .
.

There were 35 breakouts this week which comfortably beat the market averages with a gain of 1.5% at week's end.
| Get a 14 day Trial of our premium 'Platinum'
service and TradeWatch for just $9.95 and if you subsequently subscribe
to any subscription level we will credit your $9.95 to your subscription.
14
Day Platinum Trial |
The Technical Analysis Charts were enhanced to include two new features:
- The period for charts was extended to a maximum of 5 years. The previous maximum was 3 years.
- The PSAR (Parabolic Stop and Reverse) value was added to the values displayed when the mouse is rolled over a candlestick. This is only effective if the PSAR is selected as one of the four possible technical indicators.
There is no tip this week. We are continuing to work on a shorting strategy as we think this will become more important in coming weeks. Although the Head and Shoulders Top Algorithm is quite successful at selecting stocks that will breakdown, we are continuing our search for an algorithm that will provide an effective cover strategy.
Investment Advisors Using our Service
TradeRight Securities, located in a suburb of Chicago, is a full services investment management company and broker/dealer. They have been a subscriber, and user, of BreakoutWatch.com for some time now. They practice CANTATA and use Breakoutwatch.com as a “research analyst”. You can learn more about TradeRight Securities at: www.traderightsecurities.com. If you’re interested in speaking to a representative, simply call them toll-free at 1-800-308-3938 or e-mail gdragel@traderightsecurities.com.
PivotPoint Advisors, LLC takes a technical approach to investment planning and management. A breakoutwatch.com subscriber since May, 2004, they use breakouts, market signals, and now TradeWatch to enhance returns for their clients. Learn more at http://pivotpointadvisors.net or contact John Norquay at 608-826-0840 or by email at john.norquay@pivotpointadvisors.net.
Note to advisors: If you would like to be listed here, please contact us. As a service to those who subscribe to us, there is no additional charge to be listed here.
| Get a 14 day Trial of
our premium 'Platinum' service and TradeWatch for just $9.95 and
if you subsequently subscribe to any subscription
level we will credit your $9.95 to your subscription.
14
Day Platinum Trial |
| Index | Value | Change Week | Change YTD | Market1 Signal |
||||||||||||||||||||||||||||||||||||
|---|---|---|---|---|---|---|---|---|---|---|---|---|---|---|---|---|---|---|---|---|---|---|---|---|---|---|---|---|---|---|---|---|---|---|---|---|---|---|---|---|
| Dow | 12487 | -0.62% | 0.19% | enter | ||||||||||||||||||||||||||||||||||||
| NASDAQ | 2435.49 | -0.65% | 0.84% | exit | ||||||||||||||||||||||||||||||||||||
| S&P 500 | 1422.18 | -0.58% | 0.27% | enter | ||||||||||||||||||||||||||||||||||||
1The Market Signal is derived from our proprietary
market model. The market model is described on the site. 2The site also shows industry rankings based on fundamentals, combined technical and fundamentals, and on price alone (similar to IBD). The site also shows daily industry movements. |
||||||||||||||||||||||||||||||||||||||||
# of Breakouts
|
Period Average1
|
Max. Gain During Period2
|
Gain at Period Close3
|
|
|---|---|---|---|---|
| This Week | 35 | 22 | 4.33% | 1.51% |
| Last Week | 16 | 26.31 | 3.6% | -0.19% |
| 13 Weeks | 342 | 28.46 | 11.53% |
3.25% |
Sector
|
Industry
|
Breakout Count for Week
|
|---|---|---|
COMPUTER SOFTWARE & SERVICES
|
Business Software & Services
|
3
|
FINANCIAL SERVICES
|
Closed-End Fund - Equity
|
3
|
DIVERSIFIED SERVICES
|
Business Services
|
2
|
LEISURE
|
Restaurants
|
2
|
TELECOMMUNICATIONS
|
Communication Equipment
|
2
|
TELECOMMUNICATIONS
|
Wireless Communications
|
2
|
BANKING
|
Savings & Loans
|
1
|
BANKING
|
Regional - Southeast Banks
|
1
|
CHEMICALS
|
Chemicals - Major Diversified
|
1
|
COMPUTER SOFTWARE & SERVICES
|
Security Software & Services
|
1
|
CONGLOMERATES
|
Conglomerates
|
1
|
DIVERSIFIED SERVICES
|
Personal Services
|
1
|
DIVERSIFIED SERVICES
|
Staffing & Outsourcing Services
|
1
|
DRUGS
|
Drugs - Generic
|
1
|
DRUGS
|
Biotechnology
|
1
|
ELECTRONICS
|
Semiconductor - Memory Chips
|
1
|
FINANCIAL SERVICES
|
Closed-End Fund - Debt
|
1
|
INSURANCE
|
Property & Casualty Insurance
|
1
|
MANUFACTURING
|
Metal Fabrication
|
1
|
MANUFACTURING
|
Industrial Electrical Equipment
|
1
|
METALS & MINING
|
Industrial Metals & Minerals
|
1
|
REAL ESTATE
|
REIT - Diversified
|
1
|
RETAIL
|
Apparel Stores
|
1
|
TELECOMMUNICATIONS
|
Telecom Services - Foreign
|
1
|
UTILITIES
|
Electric Utilities
|
1
|
UTILITIES
|
Diversified Utilities
|
1
|
WHOLESALE
|
Medical Equipment Wholesale
|
1
|
2This represents the return if each stock were bought at its breakout price and sold at its intraday high.
3This represents the return if each stock were bought at its breakout price and sold at the most recent close.
Category |
Symbol |
Company Name |
Expected Gain1 |
|---|---|---|---|
| Best Overall | IGTE | Igate Corporaion | 103 |
| Top Technical | HALL | Hallmark Financial Services Inc | 66 |
| Top Fundamental | CTSH | Cognizant Tech Sol Cp A | 32 |
| Top Tech. & Fund. | CTSH | Cognizant Tech Sol Cp A | 32 |
Category |
Symbol |
Company Name |
Expected Gain1 |
|---|---|---|---|
| Best Overall | MCDTA | Mcdata Cl A | 98 |
| Top Technical | CVA | Covanta Holding Corp | 46 |
| Top Fundamental | CHL | China Mobile Ltd | 46 |
| Top Tech. & Fund. | CHL | China Mobile Ltd | 46 |
If you received this newletter from a friend and you would like to receive it regularly please go to the BreakoutWatch.com site and enter as a Guest. You will then be able to register to receive the newsletter.
Copyright © 2007 NBIcharts, LLC dba BreakoutWatch.com. All rights reserved.
" BreakoutWatch," the BreakoutWatch.com "eye" logo, and the slogan "tomorrow's breakouts today" are service marks of NBIcharts LLC. All other marks are the property of their respective owners, and are used for descriptive purposes only.