| Market Summary | Weekly Breakout Report | Top Breakout Choices | Top 2nd Chances | New Features | Tip of the Week |
Market Summary
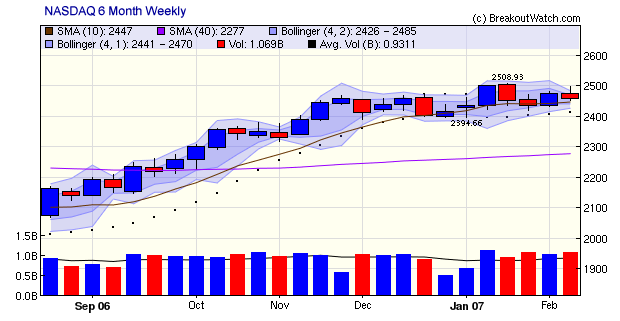
The markets lost ground this week in the face of evidence of a strengthening economy which could re-ignite inflation, warnings by two Federal Reserve Presidents that interest rates would have to rise if inflation did not abate and weakness in the financial sector as home loan providers increased their provisions for mortgage defaults. The DJI lost 0.57%, the NASDAQ Composite dropped 0.65% and the S&P 500 gave up 0.71%. Volume increased on the NASDAQ over last week (see chart below), indicating that the index came under distribution, although our count of distribution days is only two in the last fifteen sessions, well short of the five needed to cause a reversal in our market model. Volumes were lower on the DJI and S&P 500 indicating that the pull back is best described as a consolidation at the moment.
The outlook for the economy is uncertain but on balance seems to be expansionary. Early in the week we had evidence that the service sector is expanding in contrast to manufacturing which is already in recession. The service sector is a bigger contributor to GDP, so on balance GDP is expected to grow, but at a slower pace than last year. Productivity is increasing and wage costs are rising only modestly, so wage push inflation does not seem to be a current threat. The biggest unknown quantity remains the potential impact of the downturn in the housing sector, how it will affect other sectors that rely on home sales to generate appliance, furnishings and DIY sales, and whether consumer spending will contract. The increasing number of mortgage defaults indicate consumers are coming under financial pressure and the savings rate was again negative last year indicating that personal debt levels are increasing. While some observers are optimistic that the housing market has bottomed, others point to the high levels of inventory still held by home builders as evidence that further price erosion is inevitable. A warning by Toll Brothers, a leading builder of residential homes, that revenues would fall by 19% in the first quarter, reinforces that view. The slower GDP growth this year will also limit profits in most sectors and so earnings are likely to be lower this year than last, so the current level of stock prices may come under pressure. The bottom line is that investors are nervous, as always, and there is little news to support a move to the upside at present.
We always concentrate on the NASDAQ because that is where growth stocks are most represented and the weekly chart shows that it is consolidating after finding support at its 10 week (50 day) moving average. The Bollinger Bands are tightening and that usually precedes a move in one direction or another. Given the prospects for growth outlined above, we are more likely to see consolidation or a move to the downside than a breakout to the upside.

The number of breakouts fell back to 36 this week, but they closed 2% higher on average by week's end. A satisfactory performance in a week when the indexes were down.
| Get a 14 day Trial of our premium 'Platinum'
service and TradeWatch for just $9.95 and if you subsequently subscribe
to any subscription level we will credit your $9.95 to your subscription.
14
Day Platinum Trial |
Expected PSAR value added to T/A Charts
The Parabolic Stop and Reverse Indicator can be useful in detecting when a trend is reversing. Our T/A Charts have always provided the option to overlay the PSAR values on a chart and we have now added a display of the PSAR value valid for the next session. We are calling this the 'Expected PSAR'. It is shown above the chart when the PSAR indicator is selected as a technical indicator.

For more information on how this can be used in trading, see this weeks Top Tip.
Using the Expected PSAR value for the Next Session's Trading
As mentioned here before, we are working on strategies for profiting from short sales. Short positions are in some ways more risky and more difficult to manage than long positions because of the potential for a short squeeze to very quickly move against you. For this reason, it is essential to have a successful cover strategy in place. Our search for a successful cover strategy has led us to consider using the expected value of the PSAR for the next session as a buy (cover) stop. While we are not yet ready to release the strategy, we want to introduce the use of the expected PSAR value to time the exit of a short trade or the entry of a long one.
The Parabolic Stop and Reverse Indicator was developed by Welles Wilder as a method of determining when to be in a long or short position vis-a-vis any stock, ETF or commodity. We won't go into the details of the formula here but there are many references available on the internet, such as the Wikipedia.
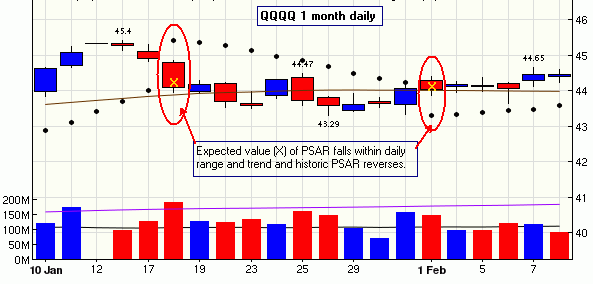
Our T/A Charts provide an option for showing the historical values of the PSAR overlayed on a chart. When the PSAR (shown as dots on the chart) is above the daily range, then the PSAR is indicating a short position, and when it is below the day's range it is indicating a long position. It is a feature of the PSAR formula that the value for any day can only be determined once the day's trading is completed, so we call that the historical value. But it is also a feature of the PSAR formula that an expected value for the next day's trading can be calculated before that day's trading has occurred. We call that the expected value. If the high and low of the next day's trading bracket the expected PSAR value, then the historic value switches. This is illustrated in the following chart of QQQQ for the last month.

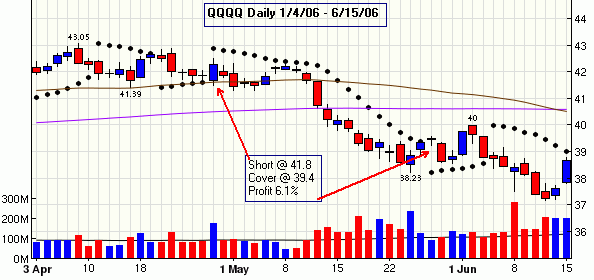
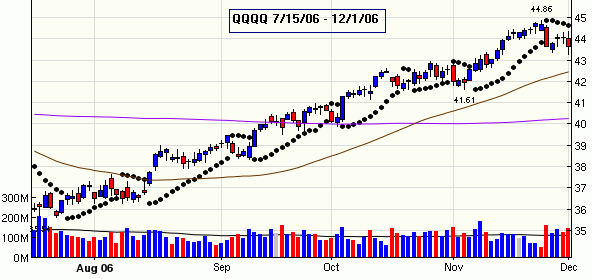
If we know the expected PSAR value for the next day's trading then then we can place a stop order to go short or long during the next session. For example, after the close on January 17, the expected value for the PSAR was (approx.) 44.2 so a sell short order with a stop of 44.2 could have been placed on the evening of the 17th. We would then have placed a day only cover stop order at the value of the expected PSAR for each subsequent day. The trade would then have been covered on 1 February with a cover stop at 44.1. The gain in this case would have been slight and illustrates that the PSAR is unreliable in a consolidating market. It is much more reliable in a strongly trending market as the next two examples show.
A profitable short sale while the NASDAQ was trending down in 2006:

Several profitable long trades were possible while the NASDAQ was recovering in 2006:

When using the expected PSAR for trading, it is essential to set the stop for the next session to the expected PSAR value prior to market open each day.
Conclusion
This discussion has served to introduce the expected PSAR value and its potential usefulness. We are not yet advocating its use in trading and the examples shown are purely for the purpose of explanation. We are experimenting with it in developing a short cover strategy and may introduce that strategy soon. Nevertheless, the expected PSAR value clearly provides you with a way to enter and exit a long or short trade a day earlier than if you wait for the historic PSAR value to be displayed after each close. If used, it should only be when a clear trend to the upside or downside has been established.
Investment Advisors Using our Service
TradeRight Securities, located in a suburb of Chicago, is a full services investment management company and broker/dealer. They have been a subscriber, and user, of BreakoutWatch.com for some time now. They practice CANTATA and use Breakoutwatch.com as a “research analyst”. You can learn more about TradeRight Securities at: www.traderightsecurities.com. If you’re interested in speaking to a representative, simply call them toll-free at 1-800-308-3938 or e-mail gdragel@traderightsecurities.com.
PivotPoint Advisors, LLC takes a technical approach to investment planning and management. A breakoutwatch.com subscriber since May, 2004, they use breakouts, market signals, and now TradeWatch to enhance returns for their clients. Learn more at http://pivotpointadvisors.net or contact John Norquay at 608-826-0840 or by email at john.norquay@pivotpointadvisors.net.
Note to advisors: If you would like to be listed here, please contact us. As a service to those who subscribe to us, there is no additional charge to be listed here.
| Get a 14 day Trial of
our premium 'Platinum' service and TradeWatch for just $9.95 and
if you subsequently subscribe to any subscription
level we will credit your $9.95 to your subscription.
14
Day Platinum Trial |
| Index | Value | Change Week | Change YTD | Market1 Signal |
||||||||||||||||||||||||||||||||||||
|---|---|---|---|---|---|---|---|---|---|---|---|---|---|---|---|---|---|---|---|---|---|---|---|---|---|---|---|---|---|---|---|---|---|---|---|---|---|---|---|---|
| Dow | 12580.8 | -0.57% | 0.94% | enter | ||||||||||||||||||||||||||||||||||||
| NASDAQ | 2459.82 | -0.65% | 1.84% | enter | ||||||||||||||||||||||||||||||||||||
| S&P 500 | 1438.06 | -0.71% | 1.39% | enter | ||||||||||||||||||||||||||||||||||||
1The Market Signal is derived from our proprietary
market model. The market model is described on the site. 2The site also shows industry rankings based on fundamentals, combined technical and fundamentals, and on price alone (similar to IBD). The site also shows daily industry movements. |
||||||||||||||||||||||||||||||||||||||||
# of Breakouts
|
Period Average1
|
Max. Gain During Period2
|
Gain at Period Close3
|
|
|---|---|---|---|---|
| This Week | 36 | 23.08 | 4.52% | 2.03% |
| Last Week | 53 | 23.38 | 7.22% | 3.69% |
| 13 Weeks | 355 | 26 | 10.64% |
4.14% |
Sector
|
Industry
|
Breakout Count for Week
|
|---|---|---|
FINANCIAL SERVICES
|
Closed-End Fund - Equity
|
4
|
FINANCIAL SERVICES
|
Closed-End Fund - Debt
|
3
|
BANKING
|
Foreign Regional Banks
|
2
|
INTERNET
|
Internet Software & Services
|
2
|
AUTOMOTIVE
|
Auto Parts
|
1
|
BANKING
|
Regional - Mid-Atlantic Banks
|
1
|
COMPUTER SOFTWARE & SERVICES
|
Business Software & Services
|
1
|
CONSUMER NON-DURABLES
|
Office Supplies
|
1
|
DIVERSIFIED SERVICES
|
Business Services
|
1
|
DIVERSIFIED SERVICES
|
Management Services
|
1
|
DIVERSIFIED SERVICES
|
Research Services
|
1
|
DRUGS
|
Biotechnology
|
1
|
ENERGY
|
Oil & Gas Pipelines
|
1
|
ENERGY
|
Independent Oil & Gas
|
1
|
FOOD & BEVERAGE
|
Beverages - Soft Drinks
|
1
|
FOOD & BEVERAGE
|
Processed & Packaged Goods
|
1
|
HEALTH SERVICES
|
Medical Appliances & Equipment
|
1
|
INSURANCE
|
Life Insurance
|
1
|
INTERNET
|
Internet Information Providers
|
1
|
INTERNET
|
Internet Service Providers
|
1
|
METALS & MINING
|
Gold
|
1
|
REAL ESTATE
|
Property Management
|
1
|
REAL ESTATE
|
REIT - Diversified
|
1
|
RETAIL
|
Apparel Stores
|
1
|
SPECIALTY RETAIL
|
Jewelry Stores
|
1
|
TELECOMMUNICATIONS
|
Wireless Communications
|
1
|
UTILITIES
|
Diversified Utilities
|
1
|
UTILITIES
|
Gas Utilities
|
1
|
WHOLESALE
|
Food Wholesale
|
1
|
2This represents the return if each stock were bought at its breakout price and sold at its intraday high.
3This represents the return if each stock were bought at its breakout price and sold at the most recent close.
Category |
Symbol |
Company Name |
Expected Gain1 |
|---|---|---|---|
| Best Overall | IGTE | Igate Corporaion | 95 |
| Top Technical | VSNT | Versant Corporation | 49 |
| Top Fundamental | RENT | Rentrak Corp | 42 |
| Top Tech. & Fund. | RENT | Rentrak Corp | 42 |
Category |
Symbol |
Company Name |
Expected Gain1 |
|---|---|---|---|
| Best Overall | SUMT | Sumtotal Systems Inc | 80 |
| Top Technical | HRT | Arrhythmia Research Tech | 49 |
| Top Fundamental | GIGM | Gigamedia Limited | 67 |
| Top Tech. & Fund. | GIGM | Gigamedia Limited | 67 |
If you received this newletter from a friend and you would like to receive it regularly please go to the BreakoutWatch.com site and enter as a Guest. You will then be able to register to receive the newsletter.
Copyright © 2007 NBIcharts, LLC dba BreakoutWatch.com. All rights reserved.
" BreakoutWatch," the BreakoutWatch.com "eye" logo, and the slogan "tomorrow's breakouts today" are service marks of NBIcharts LLC. All other marks are the property of their respective owners, and are used for descriptive purposes only.