| Market Summary | Weekly Breakout Report | Top Breakout Choices | Top 2nd Chances | New Features | Tip of the Week |
Market Summary
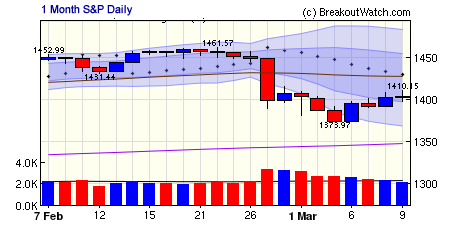
The markets stabilized and recovered moderately this week, although volumes tailed off toward the end of the week indicating that although buyers outnumbered sellers, there was not a lot of enthusiasm to push valuations higher in the face of perceived increased risk to the downside. The 1 month chart of the S&P 500 shows how dramatic the fall was when viewed from the short term and how volumes have calmed since.

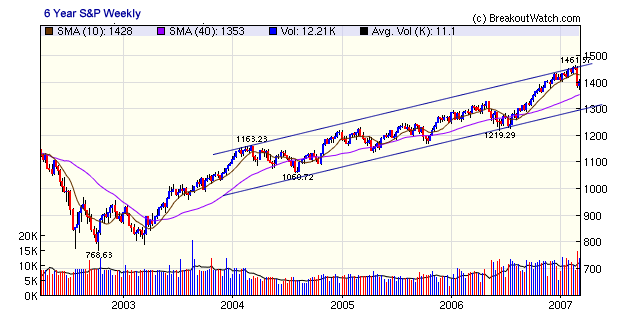
The longer view though shows that the primary trend remains intact. A break of the 200-day moving average at 1350 would indicate the trend is under threat.

For the week, the DJI gained 1.34%, the NASDAQ Composite added 0.83% and the S&P 500 rose 1.13%. The market made a short term bottom on Monday and has risen 2% since then (S&P 500). We continue to advise not opening new positions until the upward trend is confirmed by a follow-through day. Our market model considers a follow through day to be when an accumulation day occurs between the 4th and 10th day of a rally and the index closes at least 1.5% above the close of the day when the index marked its intraday low. With volumes trending down, we have not experienced that condition yet.
Friday's trading illustrates the problems the markets face at the moment. There was positive economic news in falling unemployment and rising wages, which benefits consumers who account for 70% of economic activity, but this possible stimulus to consumer spending was offset by news that New Century Financial Corp. would stop writing new mortgages and may seek bankruptcy protection. This was the thirtieth sub-prime lender to close shop since December. Goldman Sachs estimated this week that the reduction in sub-prime lending will cut new home sales by 200,000, or 20%, this year. If they are correct, then housing demand has further to fall and consumers will feel less wealthy as the value of their homes falls. This will inevitably drag consumer spending down as consumers feel less wealthy and the economy will suffer, putting the 'soft-landing' theory at risk. It will be difficult for the markets to gain traction while the threat of recession continues.
The number of successful breakouts fell to 15 this week. Many stocks are beaten down and are too far from their pivot points to achieve a successful breakout, particularly while volume levels are depressed. There is more analysis of of this in this week's top tip below.
| Get a 14 day Trial of our premium 'Platinum'
service and TradeWatch for just $9.95 and if you subsequently subscribe
to any subscription level we will credit your $9.95 to your subscription.
14
Day Platinum Trial |
There were no new features added this week.
Why there were few breakouts this week
Although the markets have stabilized and the upward trend has resumed this week, the number of breakout attempts and therefore the number of successful breakouts is down sharply. The reason is primarily because stocks are beaten down to well below their pivot price and have a significant hurdle to overcome before a breakout is possible.
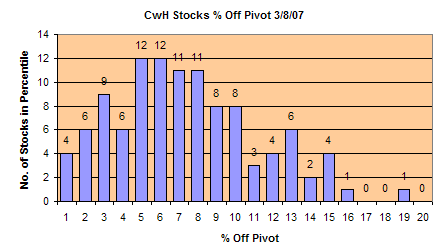
On Thursday, March 8, there were 108 stocks on the CwH list. Most of them were well below their pivot price as the following chart shows. Only 10 stocks (9%) were within 2% of their breakout price (pivot).

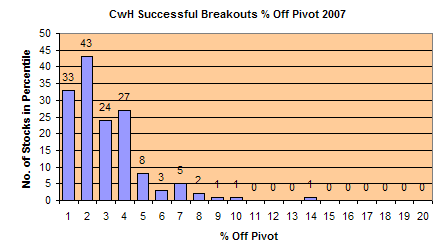
In comparison, since the start of the year, 51% of successful breakouts were within 2% of the pivot price on the eve of their breakouts.

This confirms what we would suspect, that the closer a stock is to its pivot point, then the more likely it is to breakout successfully. Some stocks can surprise, of course, even when market conditions are unfavorable. On 2/28 Cooper Tire and Rubber (CTB) closed 13.4% off its pivot price but broke out the next day on six times average volume.
If the current upward trend is maintained, then more stocks will come within striking range of their pivot points and more alerts will be issued as they reach their pivot point intraday. For the breakout attempts to be successful, they will also need to reach 150% of their average daily volume as well. For that to happen, the current tepid volume levels will need to increase.
Investment Advisors Using our Service
TradeRight Securities, located in a suburb of Chicago, is a full services investment management company and broker/dealer. They have been a subscriber, and user, of BreakoutWatch.com for some time now. They practice CANTATA and use Breakoutwatch.com as a “research analyst”. You can learn more about TradeRight Securities at: www.traderightsecurities.com. If you’re interested in speaking to a representative, simply call them toll-free at 1-800-308-3938 or e-mail gdragel@traderightsecurities.com.
PivotPoint Advisors, LLC takes a technical approach to investment planning and management. A breakoutwatch.com subscriber since May, 2004, they use breakouts, market signals, and now TradeWatch to enhance returns for their clients. Learn more at http://pivotpointadvisors.net or contact John Norquay at 608-826-0840 or by email at john.norquay@pivotpointadvisors.net.
Note to advisors: If you would like to be listed here, please contact us. As a service to those who subscribe to us, there is no additional charge to be listed here.
| Get a 14 day Trial of
our premium 'Platinum' service and TradeWatch for just $9.95 and
if you subsequently subscribe to any subscription
level we will credit your $9.95 to your subscription.
14
Day Platinum Trial |
| Index | Value | Change Week | Change YTD | Market1 Signal |
||||||||||||||||||||||||||||||||||||
|---|---|---|---|---|---|---|---|---|---|---|---|---|---|---|---|---|---|---|---|---|---|---|---|---|---|---|---|---|---|---|---|---|---|---|---|---|---|---|---|---|
| Dow | 12276.3 | 1.34% | -1.5% | enter | ||||||||||||||||||||||||||||||||||||
| NASDAQ | 2387.55 | 0.83% | -1.15% | exit | ||||||||||||||||||||||||||||||||||||
| S&P 500 | 1402.85 | 1.13% | -1.09% | enter | ||||||||||||||||||||||||||||||||||||
1The Market Signal is derived from our proprietary
market model. The market model is described on the site. 2The site also shows industry rankings based on fundamentals, combined technical and fundamentals, and on price alone (similar to IBD). The site also shows daily industry movements. |
||||||||||||||||||||||||||||||||||||||||
# of Breakouts
|
Period Average1
|
Max. Gain During Period2
|
Gain at Period Close3
|
|
|---|---|---|---|---|
| This Week | 15 | 20.77 | 0.6% | -1.3% |
| Last Week | 42 | 22.38 | 0.36% | -4.39% |
| 13 Weeks | 364 | 23 | 9.02% |
-0.59% |
Sector
|
Industry
|
Breakout Count for Week
|
|---|---|---|
FINANCIAL SERVICES
|
Closed-End Fund - Debt
|
2
|
BANKING
|
Savings & Loans
|
1
|
COMPUTER SOFTWARE & SERVICES
|
Information Technology
|
1
|
CONSUMER NON-DURABLES
|
Office Supplies
|
1
|
DIVERSIFIED SERVICES
|
Business Services
|
1
|
ENERGY
|
Oil & Gas Equipment & Services
|
1
|
FINANCIAL SERVICES
|
Diversified Investments
|
1
|
FINANCIAL SERVICES
|
Investment Brokerage - National
|
1
|
FINANCIAL SERVICES
|
Closed-End Fund - Equity
|
1
|
FOOD & BEVERAGE
|
Processed & Packaged Goods
|
1
|
RETAIL
|
Discount, Variety Stores
|
1
|
RETAIL
|
Grocery Stores
|
1
|
SPECIALTY RETAIL
|
Auto Dealerships
|
1
|
UTILITIES
|
Electric Utilities
|
1
|
2This represents the return if each stock were bought at its breakout price and sold at its intraday high.
3This represents the return if each stock were bought at its breakout price and sold at the most recent close.
Category |
Symbol |
Company Name |
Expected Gain1 |
|---|---|---|---|
| Best Overall | SMTK | 108 | |
| Top Technical | FRK | Florida Rock Industries | 42 |
| Top Fundamental | CAM | Cooper Cameron Corp | 35 |
| Top Tech. & Fund. | TALX | Talx Corporation | 35 |
Category |
Symbol |
Company Name |
Expected Gain1 |
|---|---|---|---|
| Best Overall | IGTE | Igate Corporaion | 97 |
| Top Technical | FC | Franklin Covey Co | 63 |
| Top Fundamental | IGTE | Igate Corporaion | 97 |
| Top Tech. & Fund. | IGTE | Igate Corporaion | 97 |
If you received this newletter from a friend and you would like to receive it regularly please go to the BreakoutWatch.com site and enter as a Guest. You will then be able to register to receive the newsletter.
Copyright © 2007 NBIcharts, LLC dba BreakoutWatch.com. All rights reserved.
" BreakoutWatch," the BreakoutWatch.com "eye" logo, and the slogan "tomorrow's breakouts today" are service marks of NBIcharts LLC. All other marks are the property of their respective owners, and are used for descriptive purposes only.