| Market Summary | Weekly Breakout Report | Top Breakout Choices | Top 2nd Chances | New Features | Tip of the Week |
Market Summary
The markets lost ground this week for the first time in four weeks. The DJI lost 0.4%, the NASDAQ Composite 0.72% and the S&P 500 1.19%. Most of the damage was done on Friday but Wednesday was also a distribution day. There was concern over earnings as several large companies missed expectations and the sub-prime mortgage debacle continued to weigh heavily on financial stocks. Financial stocks followed by technology are the heaviest weights in the S&P 500 so the continued meltdown among the financials and failure of Google to meet expectations dragged down the S&P more than the other indexes. The fall in the NASDAQ combined with a distribution day once again moved our NASDAQ Market signal to exit.
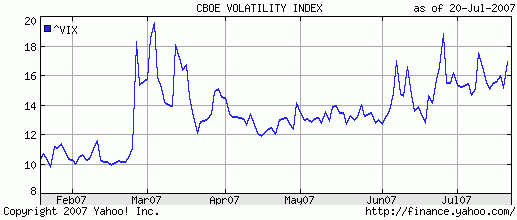
The volatility in that signal this year is closely linked to the overall increase in volatility as measured by the VIX. After trending down since 2002 the VIX has started to increase over the last 6 months, as the following chart shows. Volatility is a proxy for risk, so the chart also shows that the risk involved in being invested in the market has increased. Higher risk also implies the potential for higher returns, but also the potential for higher losses. In our 'Top Tip' this week we show how that higher risk has hurt our NASDAQ market signal when compared to its performance over the last 5 years.

The number of confirmed breakouts fell back to 14 this week, but they made an average intra-day gain of 5.73% and finished the week with a gain of 1.52%.
There were no new features added this week.
TradeWatch Performance and Market Signals 2007
We were asked this week to explain why our TradeWatch 'Buy at Open' list has under performed this year.
First, we recall that our simulation of a Buy at Open portfolio during 2006 yielded a return of 87%. (You can confirm this by running the portfolio simulation using the default Sell Assistant rules for 2006). In contrast, the same portfolio simulation for 2007 to date yields a negative -2.55%.
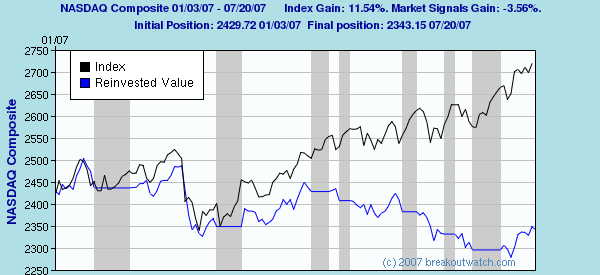
The explanation for this sudden reversal is found in the extreme volatility of the NASDAQ market signal this year. (See our discussion about the VIX above). This volatility has resulted in whipsawing as illustrated in the following chart. The shaded areas show the times when the market signal recommended being out of the market.

The chart shows that the index (black line) actually gained during most periods that the signal said 'exit' and lost ground when the index said 'enter'. The blue line shows the return you would have obtained by buying the index on January 3, 2007, selling when it said 'exit' and then buying again at the next 'enter'.
Because the default behavior of our Sell Assistant is to recommend a 'sell' whenever the NASDAQ signal goes to exit the same pattern of losing trades is reflected in the 'Buy at Open' portfolio simulation.
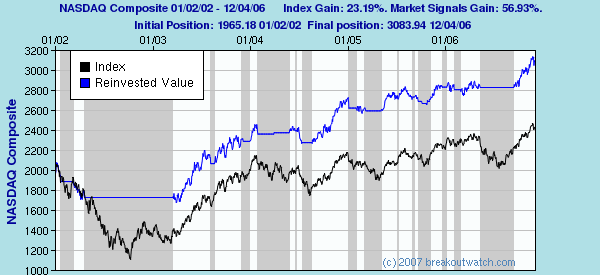
The poor performance of the signal this year contrasts with its excellent 5-year performance which is shown in the following chart where the signal gave a return in excess of twice that of the index..

Our NASDAQ Market signal was backtested over the history of the NASDAQ so we are hopeful that the performance over the first 7 months of this year is a short-term effect due to the extreme nervousness of investors this year that has resulted in such a high volatility for the index and that a return to the longer term success of the signal will soon become apparent.
Investment Advisors Using our Service
TradeRight Securities, located in a suburb of Chicago, is a full services investment management company and broker/dealer. They have been a subscriber, and user, of BreakoutWatch.com for some time now. They practice CANTATA and use Breakoutwatch.com as a “research analyst”. You can learn more about TradeRight Securities at: www.traderightsecurities.com. If you’re interested in speaking to a representative, simply call them toll-free at 1-800-308-3938 or e-mail gdragel@traderightsecurities.com.
Note to advisors: If you would like to be listed here, please contact us. As a service to those who subscribe to us, there is no additional charge to be listed here.
| Get a 14 day Trial of our premium 'Platinum'
service and TradeWatch for just $9.95 and if you subsequently subscribe
to any subscription level we will credit your $9.95 to your subscription.
14
Day Platinum Trial |
Investment Advisors Using our Service
TradeRight Securities, located in a suburb of Chicago, is a full services investment management company and broker/dealer. They have been a subscriber, and user, of BreakoutWatch.com for some time now. They practice CANTATA and use Breakoutwatch.com as a “research analyst”. You can learn more about TradeRight Securities at: www.traderightsecurities.com. If you’re interested in speaking to a representative, simply call them toll-free at 1-800-308-3938 or e-mail gdragel@traderightsecurities.com.
Note to advisors: If you would like to be listed here, please contact us. As a service to those who subscribe to us, there is no additional charge to be listed here.
| Get a 14 day Trial of
our premium 'Platinum' service and TradeWatch for just $9.95 and
if you subsequently subscribe to any subscription
level we will credit your $9.95 to your subscription.
14
Day Platinum Trial |
| Index | Value | Change Week | Change YTD | Market1 Signal |
||||||||||||||||||||||||||||||||||||
|---|---|---|---|---|---|---|---|---|---|---|---|---|---|---|---|---|---|---|---|---|---|---|---|---|---|---|---|---|---|---|---|---|---|---|---|---|---|---|---|---|
| Dow | 13851.1 | -0.4% | 11.14% | enter | ||||||||||||||||||||||||||||||||||||
| NASDAQ | 2687.6 | -0.72% | 11.27% | exit | ||||||||||||||||||||||||||||||||||||
| S&P 500 | 1534.1 | -1.19% | 8.16% | enter | ||||||||||||||||||||||||||||||||||||
1The Market Signal is derived from our proprietary
market model. The market model is described on the site. 2The site also shows industry rankings based on fundamentals, combined technical and fundamentals, and on price alone (similar to IBD). The site also shows daily industry movements. |
||||||||||||||||||||||||||||||||||||||||
# of Breakouts
|
Period Average1
|
Max. Gain During Period2
|
Gain at Period Close3
|
|
|---|---|---|---|---|
| This Week | 14 | 17.69 | 5.73% | 1.52% |
| Last Week | 28 | 18.46 | 2.93% | -1.83% |
| 13 Weeks | 320 | 19.54 | 12.26% |
2.89% |
Sector
|
Industry
|
Breakout Count for Week
|
|---|---|---|
MATERIALS & CONSTRUCTION
|
General Building Materials
|
2
|
COMPUTER HARDWARE
|
Networking & Communication Devices
|
1
|
CONSUMER DURABLES
|
Home Furnishings & Fixtures
|
1
|
DIVERSIFIED SERVICES
|
Personal Services
|
1
|
DIVERSIFIED SERVICES
|
Technical Services
|
1
|
DRUGS
|
Drug Manufacturers - Other
|
1
|
DRUGS
|
Diagnostic Substances
|
1
|
ELECTRONICS
|
Semiconductor - Integrated Circuits
|
1
|
ENERGY
|
Oil & Gas Equipment & Services
|
1
|
FINANCIAL SERVICES
|
Closed-End Fund - Equity
|
1
|
FOOD & BEVERAGE
|
Beverages - Soft Drinks
|
1
|
INSURANCE
|
Property & Casualty Insurance
|
1
|
TELECOMMUNICATIONS
|
Processing Systems & Products
|
1
|
2This represents the return if each stock were bought at its breakout price and sold at its intraday high.
3This represents the return if each stock were bought at its breakout price and sold at the most recent close.
Category |
Symbol |
Company Name |
Expected Gain1 |
|---|---|---|---|
| Best Overall | ROY | Intl Realty Corp Ord | 109 |
| Top Technical | VII | Vicon Industries Inc | 78 |
| Top Fundamental | LFC | China Life Insurance Company | 47 |
| Top Tech. & Fund. | LFC | China Life Insurance Company | 47 |
Category |
Symbol |
Company Name |
Expected Gain1 |
|---|---|---|---|
| Best Overall | VII | Vicon Industries Inc | 69 |
| Top Technical | VII | Vicon Industries Inc | 69 |
| Top Fundamental | TESO | TESCO CORP | 39 |
| Top Tech. & Fund. | TESO | TESCO CORP | 39 |
If you received this newletter from a friend and you would like to receive it regularly please go to the BreakoutWatch.com site and enter as a Guest. You will then be able to register to receive the newsletter.
Copyright © 2007 NBIcharts, LLC dba BreakoutWatch.com. All rights reserved.
" BreakoutWatch," the BreakoutWatch.com "eye" logo, and the slogan "tomorrow's breakouts today" are service marks of NBIcharts LLC. All other marks are the property of their respective owners, and are used for descriptive purposes only.