| Market Summary | Weekly Breakout Report | Top Breakout Choices | Top 2nd Chances | New Features | Tip of the Week |
Market Summary
The major indexes struggled higher this week following a tentative rally that began on Tuesday. Our market signal remains at exit, however, as we wait for a follow through day. This could have come as early as Friday but although the volume was there to provide an accumulation day, the price move was insufficient. For the week the DJI gained just over 1% while the the NASDAQ Composite and S&P 500 rose 0.35% each. Friday's gains were possibly financed by a huge injection of liquidity into the markets by the Fed on Thursday and Friday. More on that below.
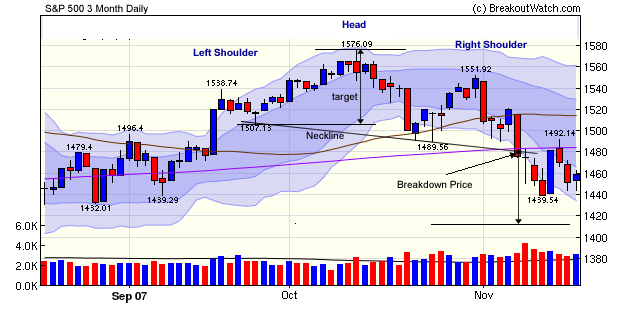
Both the S&P 500 and NASDAQ Composite have completed a head and shoulders top pattern. (For a tutorial on head and shoulders tops, see this weeks Top Tip below). Their charts are similar so we will review the S&P 500 chart here.

The chart above shows the left and right shoulders and head of the pattern. Notice that the neckline slopes down and in this case we take our target decline by measuring from the left neckline to the head. The pattern was completed when the price went through the neckline on November 7 at 1480. That gives a target bottom of about 1415. Notice that the recovery that began on Tuesday (big blue bar after the 1439 low) stalled the next day as the index met resistance at the 200 dma level, and another leg down began before Friday's upturn. Normally, technical analysis would tell us to expect the decline to resume, possibly after another test of the 200 dma level. However, these are not normal times and there is ample opportunity for the Treasury and/or Fed to manipulate the economic statistics or money supply to affect the market to the upside. For example, Reuters reports that on Thursday "The Fed injected $47.25 billion in temporary reserves, its biggest combined daily infusion since September 19, 2001". The Fed no longer publishes M3, but an estimate of M3 is available at Shadow Government Statistics which shows M3 growth at 15% p. a.
There is an increasing expectation among economists that the economy will be in recession by Q1 of 2008. (See Roubini's Blog which also links to The Economist). How this will affect the stock market is uncertain but the short term outlook is that the market must find a bottom before it can rise again. We're not convinced that last Monday was that bottom.
No new features this week.
The head and shoulders pattern is recognized as one of the most reliable trend reversal patterns. Bulkowski* reports that 93% of these patterns continue to move downwards once a breakdown occurs. It forms after an uptrend and is characterized by three peaks with the center peak higher than the two adjoining peaks. The neckline is a line drawn between the two lows between the peaks.
Our own research and backtest results are in the Newsletter Archive.
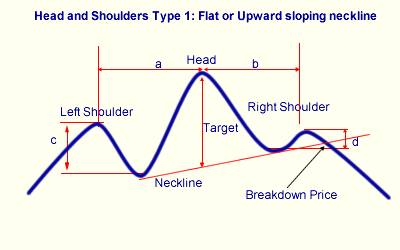
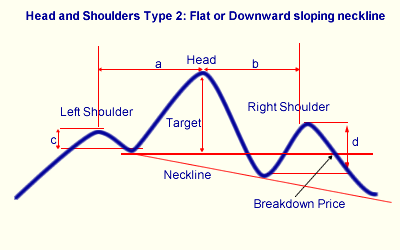
We recognize two types of head and shoulder, depending on the slope of the neckline. We do this so we can recognize a breakdown price and issue alerts when this price is met.

When the neckline is flat or slopes upwards, the breakdown price is calculated as the point where the neckline intersects the price line following formation of the right shoulder. It is at this point that the pattern is completed and a long position should be closed, or a short position opened. At this time we can calculate a 'target' decline which is the distance between the center peak's high and the neckline. Bulkowski* estimates this target is reached 63% of the time.

If the neckline slopes down, then it is possible that it will never intersect the price line following the right shoulder, so we use an alternative method of detemining a breakdown price. In this case we use the support level between the left shoulder and the head and calculate the target price as the difference between that support level and the center peak's high.
Pattern Recognition
We publish head and shoulders patterns daily when the following conditions are met.
- The stock must be in a confirmed up trend before the pattern begins. An uptrend exists if the the left shoulder is at least 30% higher than the low in the previous 6 months (120 trading days).
- The pattern width, shoulder-to-shoulder, must be 6 months (120 trading days) or less.
- The head must have occured within the last 6 months (120 trading days).
- There must be approximate symmetry to the pattern. We determine this by requiring that number days between the shoulders and the head (a and b in the diagram) must be within 50% of each other.
- There must be a noticeable trough between the left shoulder and the head (c). We chose an arbitrary minimum of 2%. This is measured from the left shoulder intraday high to the intraday high at the left neckline.
- There must be a noticeable trough between the head and the right shoulder (d). We chose an arbitrary minimum of 2%. This is measured from the right shoulder intraday high to the intraday high at the right neckline.
- For upward sloping necklines, the breakdown price is the the neckline value on the date of the last close.
- For flat or downward sloping neckline, the breakdown price is the value of the intraday low at the left neckline.
- The last close must be above the breakdown price.
- The minimum 50 day average volume must be at least 500,000. Stocks with greater liquidity are less likely to make sudden moves creating a short squeeze.
Investment Advisors Using our Service
TradeRight Securities, located in a suburb of Chicago, is a full services investment management company and broker/dealer. They have been a subscriber, and user, of BreakoutWatch.com for some time now. They practice CANTATA and use Breakoutwatch.com as a “research analyst”. You can learn more about TradeRight Securities at: www.traderightsecurities.com. If you’re interested in speaking to a representative, simply call them toll-free at 1-800-308-3938 or e-mail gdragel@traderightsecurities.com.
Note to advisors: If you would like to be listed here, please contact us. As a service to those who subscribe to us, there is no additional charge to be listed here.
Get a 14 day free
Trial of our premium 'Platinum' service and TradeWatch.
No Credit Card Required.
Click
Here for 14 Day Free Trial |
| Index | Value | Change Week | Change YTD | Market1 Signal |
||||||||||||||||||||||||||||||||||||
|---|---|---|---|---|---|---|---|---|---|---|---|---|---|---|---|---|---|---|---|---|---|---|---|---|---|---|---|---|---|---|---|---|---|---|---|---|---|---|---|---|
| Dow | 13176.8 | 1.03% | 5.73% | enter | ||||||||||||||||||||||||||||||||||||
| NASDAQ | 2637.24 | 0.35% | 9.19% | enter | ||||||||||||||||||||||||||||||||||||
| S&P 500 | 1458.74 | 0.35% | 2.85% | exit | ||||||||||||||||||||||||||||||||||||
1The Market Signal is derived from our proprietary
market model. The market model is described on the site. 2The site also shows industry rankings based on fundamentals, combined technical and fundamentals, and on price alone (similar to IBD). The site also shows daily industry movements. |
||||||||||||||||||||||||||||||||||||||||
# of Breakouts
|
Period Average1
|
Max. Gain During Period2
|
Gain at Period Close3
|
|
|---|---|---|---|---|
| This Week | 9 | 15.62 | 3.41% | 0.8% |
| Last Week | 18 | 15.15 | 5.5% | -2.7% |
| 13 Weeks | 213 | 15.85 | 19.28% |
-0.23% |
Sector
|
Industry
|
Breakout Count for Week
|
|---|---|---|
CHEMICALS
|
Specialty Chemicals
|
1
|
DRUGS
|
Drug Manufacturers - Major
|
1
|
FINANCIAL SERVICES
|
Diversified Investments
|
1
|
FINANCIAL SERVICES
|
Investment Brokerage - National
|
1
|
FOOD & BEVERAGE
|
Food - Major Diversified
|
1
|
HEALTH SERVICES
|
Medical Laboratories & Research
|
1
|
UTILITIES
|
Electric Utilities
|
1
|
WHOLESALE
|
Electronics Wholesale
|
1
|
WHOLESALE
|
Drugs Wholesale
|
1
|
2This represents the return if each stock were bought at its breakout price and sold at its intraday high.
3This represents the return if each stock were bought at its breakout price and sold at the most recent close.
Category |
Symbol |
Company Name |
Expected Gain1 |
|---|---|---|---|
| Best Overall | OSTE | Osteotech Inc | 88 |
| Top Technical | TPC | SunCom Wireless Holdings Inc | 15 |
| Top Fundamental | EV | Eaton Vance Corp | 39 |
| Top Tech. & Fund. | EV | Eaton Vance Corp | 39 |
Category |
Symbol |
Company Name |
Expected Gain1 |
|---|---|---|---|
| Best Overall | AMPL | Ampal-Amer Israel Cl A | 76 |
| Top Technical | CELL | Brightpoint Inc | 41 |
| Top Fundamental | OXPS | Optionsxpress Holdings | 38 |
| Top Tech. & Fund. | CELL | Brightpoint Inc | 41 |
If you received this newletter from a friend and you would like to receive it regularly please go to the BreakoutWatch.com site and enter as a Guest. You will then be able to register to receive the newsletter.
Copyright © 2007 NBIcharts, LLC dba BreakoutWatch.com. All rights reserved.
" BreakoutWatch," the BreakoutWatch.com "eye" logo, and the slogan "tomorrow's breakouts today" are service marks of NBIcharts LLC. All other marks are the property of their respective owners, and are used for descriptive purposes only.