| Market Summary | Weekly Breakout Report | Top Breakout Choices | Top 2nd Chances | New Features | Tip of the Week |
Market Summary
We expected the markets to move lower this week after last Friday's action but the downward momentum was reversed on Wednesday as news of a pending 'solution' to the subprime mortgage problems surfaced. The markets reacted warmly to the proposal on Thursday but two days of strong gains were halted on Friday as job growth exceeded analysts' expectations and lowered the chances of a 0.5% rate cut at next Tuesday's FOMC meeting.
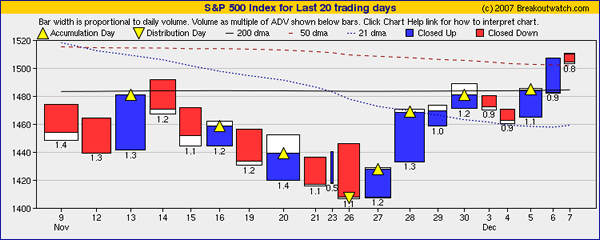
The expectation of a 0.5% rate cut has fueled the recent rally that began on November 27 and since then the market has been under accumulation with just three days of profit taking on lighter volume. Our equivolume charts (published daily) give a snapshot of market conditions and illustrate the strength of the recovery.

Despite this progress, our market signal for the S&P 500 remains at 'exit' and we examine the reasons for that in this weeks top tip. We have considered overriding the signal but resist doing so for two reasons:
- The recent growth is based on an expectation that the FOMC will cut rates by 0.5%. A cut of only 0.25% (or less!) would be a disappointment and result in a sell-off.
- The measures announced on Thursday to contain the subprime mortgage crisis will do little to assist stressed homeowners, mortgage backed securities investors or homebuilders. When this is realized, the markets will resume their decline.
Unfortunately, we also fear that any attempt to apply logic to the current situation is pointless as the markets are rigged . We have thought and said for weeks now that the administration is determined to keep the markets buoyant whatever the costs to inflation and dollar strength. We therefore think that the Fed will cut rates by at least 0.5% on Tuesday and that once it is realized that the current subprime plan will not adequately protect the financial sector from further steep losses another plan will be hatched and promoted.
The number of breakouts doubled this week to fifteen for an average gain by week's end of 2.96%, comfortanly beating the market averages. Of the fifteen, only two closed the week with a modest loss.
No new features this week.
Why the Market Model Still Says 'Exit'
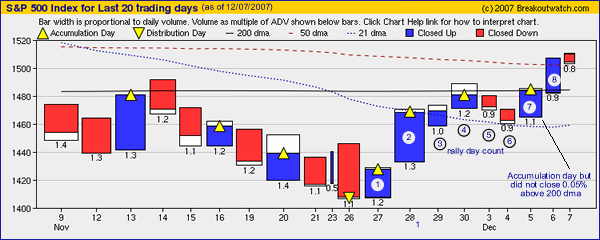
Our market model signaled an exit for the S&P 500 (representing the broader market) on November 1. From its close of 1508.44 on that date it subsequently lost 6.8% but has now recovered those losses since a rally began on November 27. Despite those gains in just seven sessions, our market model still stays at 'exit'.
The model requires an accumulation day on which the market closes at least 1.5% above the low on the fourth or subsequent day of the rally AND that the close be above the 200 day moving average by 0.05%.
A look at our equivolume chart shows that the first accumulation day came on the fourth day of the rally but the close was below the 200 dma. The next accumulation day came on the seventh day of the rally. The index did close above the 200 dma, but by less than 0.05%, so the signal stayed at exit.

If the S&P 500 closes higher and we get an accumulation day following the FOMC meeting on Tuesday, then the signal will revert to 'enter'.
Investment Advisors Using our Service
TradeRight Securities, located in a suburb of Chicago, is a full services investment management company and broker/dealer. They have been a subscriber, and user, of BreakoutWatch.com for some time now. They practice CANTATA and use Breakoutwatch.com as a “research analyst”. You can learn more about TradeRight Securities at: www.traderightsecurities.com. If you’re interested in speaking to a representative, simply call them toll-free at 1-800-308-3938 or e-mail gdragel@traderightsecurities.com.
Note to advisors: If you would like to be listed here, please contact us. As a service to those who subscribe to us, there is no additional charge to be listed here.
Get a 14 day free
Trial of our premium 'Platinum' service and TradeWatch.
No Credit Card Required.
Click
Here for 14 Day Free Trial |
| Index | Value | Change Week | Change YTD | Market1 Signal |
||||||||||||||||||||||||||||||||||||
|---|---|---|---|---|---|---|---|---|---|---|---|---|---|---|---|---|---|---|---|---|---|---|---|---|---|---|---|---|---|---|---|---|---|---|---|---|---|---|---|---|
| Dow | 13625.6 | 1.9% | 9.33% | enter | ||||||||||||||||||||||||||||||||||||
| NASDAQ | 2706.16 | 1.7% | 12.04% | enter | ||||||||||||||||||||||||||||||||||||
| S&P 500 | 1504.66 | 1.59% | 6.09% | exit | ||||||||||||||||||||||||||||||||||||
1The Market Signal is derived from our proprietary
market model. The market model is described on the site. 2The site also shows industry rankings based on fundamentals, combined technical and fundamentals, and on price alone (similar to IBD). The site also shows daily industry movements. |
||||||||||||||||||||||||||||||||||||||||
# of Breakouts
|
Period Average1
|
Max. Gain During Period2
|
Gain at Period Close3
|
|
|---|---|---|---|---|
| This Week | 16 | 16.08 | 4.86% | 2.81% |
| Last Week | 8 | 15.85 | 7.68% | 1.43% |
| 13 Weeks | 224 | 16.85 | 16.09% |
1.4% |
Sector
|
Industry
|
Breakout Count for Week
|
|---|---|---|
FINANCIAL SERVICES
|
Closed-End Fund - Equity
|
3
|
MANUFACTURING
|
Industrial Electrical Equipment
|
2
|
CHEMICALS
|
Specialty Chemicals
|
1
|
CONSUMER NON-DURABLES
|
Cleaning Products
|
1
|
DIVERSIFIED SERVICES
|
Business Services
|
1
|
DRUGS
|
Biotechnology
|
1
|
DRUGS
|
Drug Delivery
|
1
|
HEALTH SERVICES
|
Health Care Plans
|
1
|
INSURANCE
|
Property & Casualty Insurance
|
1
|
METALS & MINING
|
Steel & Iron
|
1
|
RETAIL
|
Catalog & Mail Order Houses
|
1
|
SPECIALTY RETAIL
|
Auto Dealerships
|
1
|
TRANSPORTATION
|
Shipping
|
1
|
2This represents the return if each stock were bought at its breakout price and sold at its intraday high.
3This represents the return if each stock were bought at its breakout price and sold at the most recent close.
Category |
Symbol |
Company Name |
Expected Gain1 |
|---|---|---|---|
| Best Overall | DVD | Dover Motorsports Inc | 81 |
| Top Technical | ISIS | Isis Pharmaceuticals Inc | 37 |
| Top Fundamental | UIC | United Industrial Corp | 10 |
| Top Tech. & Fund. | UIC | United Industrial Corp | 10 |
Category |
Symbol |
Company Name |
Expected Gain1 |
|---|---|---|---|
| Best Overall | SDTH | 83 | |
| Top Technical | PTT | Vcg Holding Copr | 72 |
| Top Fundamental | PTT | Vcg Holding Copr | 72 |
| Top Tech. & Fund. | PTT | Vcg Holding Copr | 72 |
If you received this newletter from a friend and you would like to receive it regularly please go to the BreakoutWatch.com site and enter as a Guest. You will then be able to register to receive the newsletter.
Copyright © 2007 NBIcharts, LLC dba BreakoutWatch.com. All rights reserved.
" BreakoutWatch," the BreakoutWatch.com "eye" logo, and the slogan "tomorrow's breakouts today" are service marks of NBIcharts LLC. All other marks are the property of their respective owners, and are used for descriptive purposes only.