| Market Summary | Weekly Breakout Report | Top Breakout Choices | Top 2nd Chances | New Features | Tip of the Week |
Market Summary
Gravestone Doji Signals Probable End to Rally
The market indexes that are of most interest to CAN SLIM* style investors are the NASDAQ Composite and Russell 2000. These indexes contain the stocks that are most likely to have the biggest price moves, under normal market conditions, and therefore have the greatest potential for profit. For these reasons, our weekly analysis has tended to focus on the NASDAQ and more recently on the Russell 2000 since we added coverage of that index to our daily market analysis feature. Alas, these are not normal market conditions due to the risk that Government or Federal Reserve intervention can suddenly move the markets dramatically. For several months now we have cautioned our subscribers to be aware that the Administration would do everything in its power to support the markets in an election year and that surprise intervention would increase market risk.
It is clear now though that supporting the markets is a secondary goal and that the primary objective is to save the financial system from systemic collapse. In its support for the Bear Sterns takeover, and the unprecedented decision to open the discount window to non-bank primary dealers (who previously could not borrow Fed funds directly, but must deal with large banks) the Fed has signaled that no large brokerage institution will be allowed to fail. This immediately stopped the short selling of Lehman Brothers (LEH) and triggered a market rally that many pundits said was the turning point. LEH received another boost when it announced quarterly results that beat expectations. But as we know, accounting is an art, not a science and it seems a Michelangelo was at work in the preparation of the Lehman results. Through careful interpretation of the SEC's 'tangible equity' rule they were actually able to count their debt as equity!!! (see portfolio.com). In other words, their results are suspect and may hide more than they reveal. Confidence in the markets can only be maintained through transparency, and as we shall see in a moment, the confidence that we have seen the market bottom is now fading as another down-leg begins.
Another confidence issue: while asset write-downs so far have been large (Morgan Stanley estimate of $400 billion), they have the potential to be much larger. The balance sheets of the banks and brokerages are benefiting from an accounting rule that says they do not have to 'mark-to-market' if the assets are triple-A rated and they can carry them on their balance sheets at par. As long as the monoline insurance brokers (Ambac, MBIA, etc) maintain their triple-A rating, the assets they insure are triple-A rated also. If the monolines get down-rated, more blood will flow. Some observers believe more losses are inevitable (Nouriel Roubini: " The losses that we're facing at this point — $1 trillion — is the floor, not the ceiling").
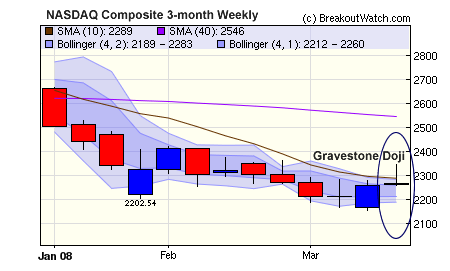
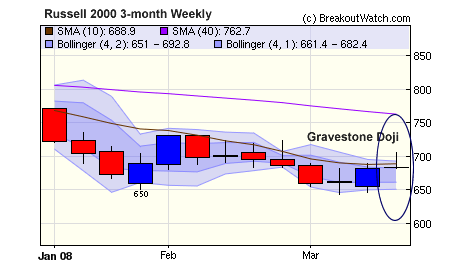
We can now see why confidence that we have seen the bottom is fading and that brings us to the 'Gravestone Doji'. Both the NASDAQ and the Russell 2000 weekly charts show a near perfect 'Gravestone Doji' pattern. The tall shadow implies that the bulls drove prices higher but lost almost all their gains by week's end. This implies these indexes will open lower next week and that the rally is in jeopardy.


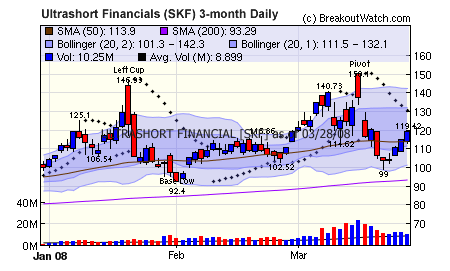
Another indication of the lack of trust in financial stocks is the recovery of Ultrashort Financials (SKF) after collapsing following the Bear Sterns bailout announcement. Although deep into the handle of a CwH formation, this ETF offers the possibility to profit from the lack of confidence in this sector, which is now close to the bottom of our industry rankings.

*CAN SLIM is a registered trademark of Data Analysis, Inc. Breakoutwatch.com is not affiliated with Investor's Business Daily or Mr. William O'Neil
No New Features this Week
Investment Advisors Using our Service
TradeRight Securities, located in a suburb of Chicago, is a full services investment management company and broker/dealer. They have been a subscriber, and user, of BreakoutWatch.com for some time now. They practice CANTATA and use Breakoutwatch.com as a “research analyst”. You can learn more about TradeRight Securities at: www.traderightsecurities.com. If you’re interested in speaking to a representative, simply call them toll-free at 1-800-308-3938 or e-mail gdragel@traderightsecurities.com.
Note to advisors: If you would like to be listed here, please contact us. As a service to those who subscribe to us, there is no additional charge to be listed here.
Get a 14 day free
Trial of our premium 'Platinum' service and TradeWatch.
No Credit Card Required.
Click
Here for 14 Day Free Trial |
| Index | Value | Change Week | Change YTD | Market1 Signal |
||||||||||||||||||||||||||||||||||||
|---|---|---|---|---|---|---|---|---|---|---|---|---|---|---|---|---|---|---|---|---|---|---|---|---|---|---|---|---|---|---|---|---|---|---|---|---|---|---|---|---|
| Dow | 12216.4 | -1.17% | -7.9% | enter | ||||||||||||||||||||||||||||||||||||
| NASDAQ | 2261.18 | 0.14% | -14.75% | exit | ||||||||||||||||||||||||||||||||||||
| S&P 500 | 1315.22 | -1.07% | -10.43% | enter | ||||||||||||||||||||||||||||||||||||
| Russell 2000 | 683.18 | 0.26% | -10.82% | N/A | ||||||||||||||||||||||||||||||||||||
1The Market Signal is derived from our proprietary
market model. The market model is described on the site. 2The site also shows industry rankings based on fundamentals, combined technical and fundamentals, and on price alone (similar to IBD). The site also shows daily industry movements. |
||||||||||||||||||||||||||||||||||||||||
# of Breakouts |
Period Average1 |
Max. Gain During Period2 |
Gain at Period Close3 |
|
|---|---|---|---|---|
| This Week | 6 | 13.08 | 5.51% | 1.31% |
| Last Week | 12 | 12.77 | 6.39% | 1.71% |
| 13 Weeks | 197 | 13.23 | 8.6% |
-3.37% |
Sector |
Industry |
Breakout Count for Week |
|---|---|---|
ENERGY |
Independent Oil & Gas |
3 |
COMPUTER SOFTWARE & SERVICES |
Business Software & Services |
1 |
DIVERSIFIED SERVICES |
Management Services |
1 |
ENERGY |
Oil & Gas Drilling & Exploration |
1 |
2This represents the return if each stock were bought at its breakout price and sold at its intraday high.
3This represents the return if each stock were bought at its breakout price and sold at the most recent close.
Category |
Symbol |
Company Name |
Expected Gain1 |
|---|---|---|---|
| Best Overall | UFPT | Ufp Technologies Inc | 108 |
| Top Technical | TUX | Tuxis Corporation | 78 |
| Top Fundamental | ADBL | Audible Inc | 62 |
| Top Tech. & Fund. | CVA | Covanta Holding Corp | 48 |
Category |
Symbol |
Company Name |
Expected Gain1 |
|---|---|---|---|
| Best Overall | PQ | Petroquest Energy Inc | 67 |
| Top Technical | CRK | Comstock Resources Inc | 52 |
| Top Fundamental | NBR | Nabors Industries Inc | 38 |
| Top Tech. & Fund. | PQ | Petroquest Energy Inc | 67 |
If you received this newletter from a friend and you would like to receive it regularly please go to the BreakoutWatch.com site and enter as a Guest. You will then be able to register to receive the newsletter.
Copyright © 2008 NBIcharts, LLC dba BreakoutWatch.com. All rights reserved.
" BreakoutWatch," the BreakoutWatch.com "eye" logo, and the slogan "tomorrow's breakouts today" are service marks of NBIcharts LLC. All other marks are the property of their respective owners, and are used for descriptive purposes only.