| Market Summary | Weekly Breakout Report | Top Breakout Choices | Top 2nd Chances | New Features | Tip of the Week |
This week's newsletter has some exciting new content. It is lengthy, but we hope you will read it all and benefit from it.
There
were several signs that market conditions for swing traders and medium
term investors were improving this week:
- Tuesday's near record gains were sustained through to week's end. This is contrary to the recent history when large gains have been followed by similarly large losses
- As the market summary below shows, the indexes made some very impressive gains. The Russell 2000 performed best with a 12% gain
- The gains were held into the close on Friday, indicating that nervousness about weekend events has diminished
- TED Spread and Libor rates are coming down slowly, although they are still way too high for free credit flow.
- Most importantly for our subscribers, we are starting to see some breakout attempts with two being successful. These were the first successful breakouts since October 2. AFAM, which broke out on Thursday and was selected by our highly acclaimed 'BOW' filter, closed 12.5% above its breakout price.
So with valuations low, and prospects for a sustainable rally improving, this is a good time to be contemplating returning to the market. For this reason, we are expanding our daily market analysis statistics to include the Wilshire 5000, which is the broadest measure of US equities performance, and adding new market trend metrics.
Today we are re-introducing our market signals after dropping them for a few weeks because they were clearly not appropriate under the new market conditions. We are now adopting a a trend identification approach rather than a simple 'enter' or 'exit' rule. For the new signals we have chosen to follow five indexes that reflect different aspects of the market:
- The Dow Jones Industrials (DJI) is a price weighted index that tracks 30 large cap stocks representative of the overall US economy.
- The S&P 500 (SPX) is a market capitalization (share price times the number of outstanding shares) weighted index of the largest 500 US stocks traded on the NYSE and NASDAQ exchanges
- The NASDAQ Composite Index (IXIC) is a market capitalization weighted index of over 3000 stocks and ADR's that trade on the NASDAQ exchange. Because it includes foreign stocks it is not exclusively representative of the US market. The NASDAQ Composite is considered the most representative index of growth stock and tech. stock performance.
- The Russell 2000 (RUT) is a market capitalization weighted index of the smaller 2000 companies in the Russell 3000.
- The Wilshire 5000 (DWC) is a market capitalization weighted index of the market value of all stocks actively traded in the USA. As such, it represent the overall market performance.
For each of these indexes we have developed a model that determines the current trend of the index in question. We report this trend as "up" or "down" on our Market Analysis page each day. If one is invested only when the trend is "up" then one expects that the overall return over an extended period of time will be higher than if one were to "buy and hold" for the same period.
The charts below show the model applied to the five indexes since 2001. The charts show that by being invested in the index only during a model identified 'up' trend substantially better performance can be obtained than if one simply buys and holds the index. Note though that because there is always a lag between the true start of a trend and the time that the model recognizes the trend is confirmed, it is always possible to lose in the short term and gains are only made through persistent application of the model.
The charts show the daily index value against the left axis and the effective gain in the index while in a model identified 'up' trend on the right. The vertical gray zones show the periods when the index was in a down trend.
Let's consider the Dow Jones chart to understand what the charts represent. Beginning in 2001, the model first recognizes an up trend on 5/11/2001 when the index is at 101820 but then recognizes the trend has turned downward on 8/24/2001 when the index has fallen to 10423. The first red line segment on the chart shows the loss and the right axis shows the effective gain was negative. The model stays out of the market until 8/29/2003 when it detects a new upward trend and this continues until 6/17/2008. This is shown by the second red line segment and the right axis shows the effective gain has gone from -397 to +2742.
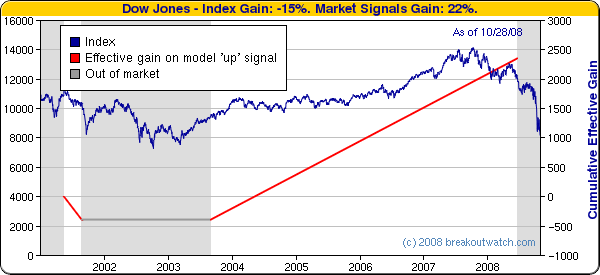
The DJI is the least volatile index and the market trend model is consequently very conservative about when to call a change in trend. Note that the model would have kept an investor in cash during most of the 2001-2003 recession and since June 2008.

The trend model is more successful with the S&P 500 keeping an investor out of the market during the whole of the 2001-2003 recession and since January this year.
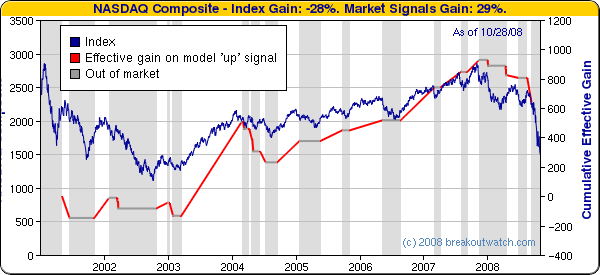
The trend model when applied to the NASDAQ avoided most of the losses following the dot com crash.
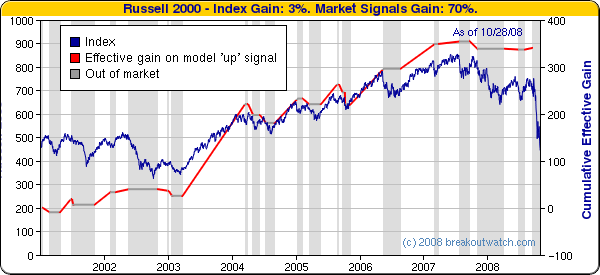
The high volatility of the Russell 2000 causes frequent trend shifts but the model accurately selects the up trends with very few losing periods.
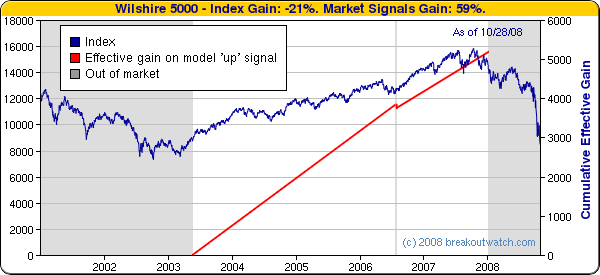
The trend model is very conservative about the overall market and does not detect an upward trend until May 2003. Using this model an investor would have been mostly invested from then until January of 2008.
While the market trend indicators give an overview of the state of different markets, the question naturally arises as to how to which trend signals should be used for trading an individual stock . To answer that question we have developed a new tool that we call the Stock Timeliness Checkup tool. You will find it under the Evaluate menu.
For a limited time this is available to all subscribers and is an excellent reason to take a free trial today.
The tool allows you to compare the performance of any stock against the five market signals over any period up to the last five years.
The initial screen asks for a stock symbol, the dates you want to compare for and the index to compare to.
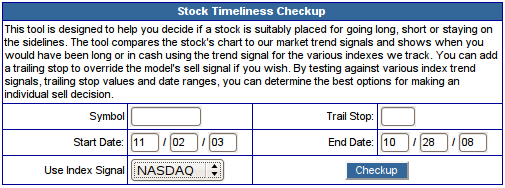
As an example, lets
look at Apple over the last three years against the NASDAQ trend signal.
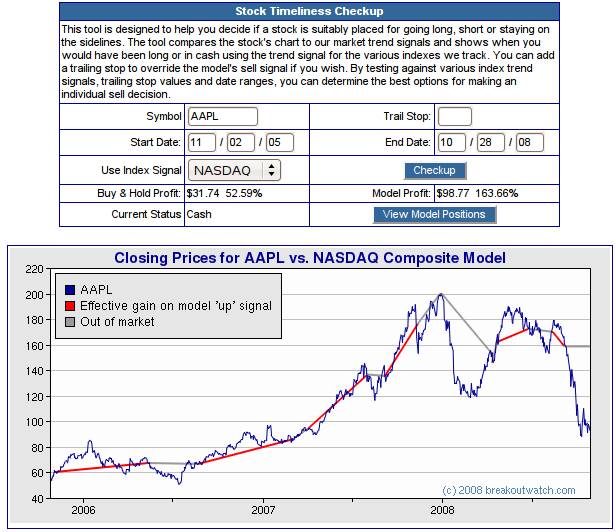
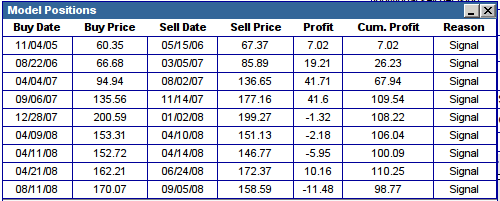
We can see the trades that would have been made by clicking the 'View
Model Positions' button.
Finally, we can try
to improve the model results by adding a trailing stop. After
experimentation, we find that a trailing stop of 6% gives an improved
performance.
You can repeat the process against the other index trends and with
varying trailing stops to find the most appropriate scenario for any
stocks you own, or are considering owning.
| Index | Value | Change Week | Change YTD | ||||||||||||||||||||||||||||||||||||
|---|---|---|---|---|---|---|---|---|---|---|---|---|---|---|---|---|---|---|---|---|---|---|---|---|---|---|---|---|---|---|---|---|---|---|---|---|---|---|---|
| Dow | 9325.01 | 10.01% | -29.7% | ||||||||||||||||||||||||||||||||||||
| NASDAQ | 1720.95 | 10.88% | -35.11% | ||||||||||||||||||||||||||||||||||||
| S&P 500 | 968.75 | 10.49% | -34.03% | ||||||||||||||||||||||||||||||||||||
| Russell 2000 | 527.78 | 12.03% | -31.1% | ||||||||||||||||||||||||||||||||||||
1The
Market Signal is derived from our proprietary
market model. The market model is described on the site.
2The site also shows industry rankings based on fundamentals, combined technical and fundamentals, and on price alone. The site also shows daily industry movements. |
|||||||||||||||||||||||||||||||||||||||
|
# of Breakouts
|
Period Average1
|
Max. Gain During Period2
|
Gain at Period Close3
|
|
|---|---|---|---|---|
| This Week | 2 | 18.15 | 10.02% | 7.8% |
| Last Week | 21 | 0% | 0% | |
| 13 Weeks | 256 | 21.08 | 12.87% |
-19.58% |
2This represents the return if each stock were bought at its breakout price and sold at its intraday high.
3This represents the return if each stock were bought at its breakout price and sold at the most recent close.
|
Category
|
Symbol
|
Company Name
|
Expected Gain1
|
|---|---|---|---|
| Best Overall | HOTT | Hot Topic Inc | 96 |
| Top Technical | SINT | Si International | 23 |
| Top Fundamental | DV | Devry Inc | 38 |
| Top Tech. & Fund. | DV | Devry Inc | 38 |
|
Category
|
Symbol
|
Company Name
|
Expected Gain1
|
|---|---|---|---|
| Best Overall | ALGT | ALLEGIANT TRAVEL | 45 |
| Top Technical | ALGT | ALLEGIANT TRAVEL | 45 |
| Top Fundamental | ALGT | ALLEGIANT TRAVEL | 45 |
| Top Tech. & Fund. | ALGT | ALLEGIANT TRAVEL | 45 |
If you received this newletter from a friend and you would like to receive it regularly please go to the BreakoutWatch.com site and enter as a Guest. You will then be able to register to receive the newsletter.
Copyright © 2008 NBIcharts, LLC dba BreakoutWatch.com.
All rights reserved.
"
BreakoutWatch," the BreakoutWatch.com "eye" logo, and the
slogan "tomorrow's breakouts today" are service marks of NBIcharts
LLC. All other marks are the property of their respective owners, and
are
used for descriptive purposes only.
BreakoutWatch is not affiliated with Investor's Business
Daily or with Mr. William O'Neil.
Our site, research and analysis is supported entirely by subscription
and is free from advertising.