| Market Summary | Weekly Breakout Report | Top Breakout Choices | Top 2nd Chances | New Features | Tip of the Week |
Despite mostly upbeat third quarter earnings, the S&P 500, NASDAQ Composite and Russell 2000 came under distribution this week as investors took profits.
Bloomberg reports that "All but 20 of the 138 companies in the S&P 500 that reported third-quarter results this week beat the average analyst estimate, including Apple Inc., Caterpillar Inc. and Morgan Stanley ... Since the start of the third-quarter earnings season, 80 percent of the companies in the S&P 500 that released results have reported better-than-estimated profits ...There’s not a higher proportion in data going back to 1993. "
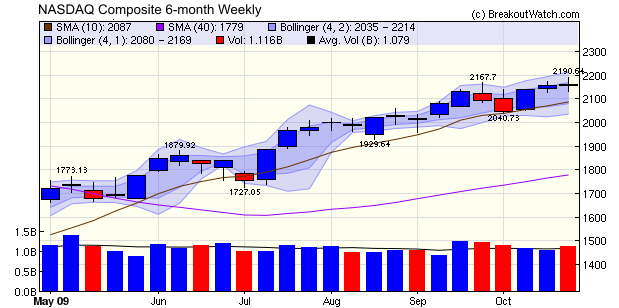
It seems that investors have a hard time believing in the reality of the recovery, even though there is evidence that we are already out of recession and that earnings will continue to improve. The weekly chart of the NASDAQ composite shows the indecision present in the market as the 'DOJI' candlestick reappears as it has so often this year. Usually, the uncertainty has resolved itself to the upside and we expect the same result this time because of our position in the economic cycle.

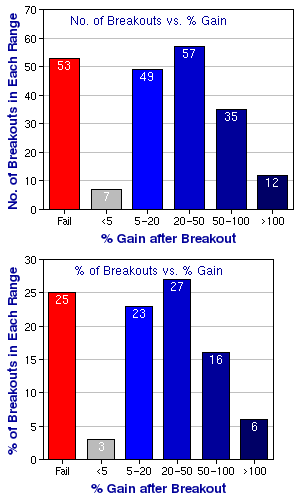
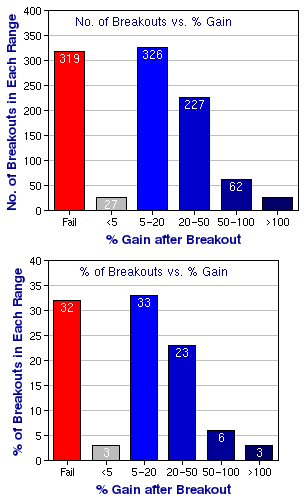
In our 9/18/2009 newsletter we highlighted the superior performance of the high tight flag (HTF) pattern over the cup-with-handle (CwH). The introduction of the HTF performance report this week gives us another opportunity to emphasize how well breakouts from this pattern perform.
The histograms below are drawn from the performance reports for the HTF and CwH patterns. For each pattern, the upper chart shows the number of breakouts since January 1, 2008 that achieved maximum gains in the groupings shown, while the lower chart shows the percentage of breakouts that fell within each grouping.
The histograms clearly show the that the gains are skewed to the higher end of the gain ranges in the case of the HTF breakouts.
While there has been an exceptional number of HTF patterns this year because of the rapid recovery since March, the same conditions have produced a high number of CwH patterns. The comparison shows that given the choice of investing in a CwH breakout or a HTF breakout, the HTF is the wiser choice.
| High Tight Flag Performance | Cup-with-Handle Performance |
 |
 |
| Index | Value | Change Week | Change YTD | Trend | ||||||||||||||||||||||||||||||||||||
|---|---|---|---|---|---|---|---|---|---|---|---|---|---|---|---|---|---|---|---|---|---|---|---|---|---|---|---|---|---|---|---|---|---|---|---|---|---|---|---|---|
| Dow | 9972.18 | -0.24% | 13.63% | Down | ||||||||||||||||||||||||||||||||||||
| NASDAQ | 2154.47 | -0.11% | 36.62% | Up | ||||||||||||||||||||||||||||||||||||
| S&P 500 | 1079.6 | -0.74% | 19.52% | Up | ||||||||||||||||||||||||||||||||||||
| Russell 2000 | 600.86 | -2.49% | 20.3% | Up | ||||||||||||||||||||||||||||||||||||
| Wilshire 5000 | 11117.5 | -0.91% | 22.34% | Up | ||||||||||||||||||||||||||||||||||||
1The Market Signal is derived from our proprietary
market model. The market model is described on the site. 2The site also shows industry rankings based on fundamentals, combined technical and fundamentals, and on price alone. The site also shows daily industry movements. |
||||||||||||||||||||||||||||||||||||||||
# of Breakouts |
Period Average1 |
Max. Gain During Period2 |
Gain at Period Close3 |
|
|---|---|---|---|---|
| This Week | 10 | 12.08 | 5.76% | 1.77% |
| Last Week | 8 | 13.23 | 7.23% | -2.39% |
| 13 Weeks | 166 | 13.77 | 20.32% |
5.85% |
2This represents the return if each stock were bought at its breakout price and sold at its intraday high.
3This represents the return if each stock were bought at its breakout price and sold at the most recent close.
Category |
Symbol |
Company Name |
Expected Gain1 |
|---|---|---|---|
| Best Overall | SWC | Stillwater Mining Co | 101 |
| Top Technical | CBOU | Caribou Coffee Company Inc | 81 |
| Top Fundamental | ADY | AMERICAN DAIRY INC | 45 |
| Top Tech. & Fund. | ADY | AMERICAN DAIRY INC | 45 |
Category |
Symbol |
Company Name |
Expected Gain1 |
|---|---|---|---|
| Best Overall | CBOU | Caribou Coffee Company Inc | 84 |
| Top Technical | CBOU | Caribou Coffee Company Inc | 84 |
| Top Fundamental | CBOU | Caribou Coffee Company Inc | 84 |
| Top Tech. & Fund. | CBOU | Caribou Coffee Company Inc | 84 |
If you received this newsletter from a friend and you would like to receive it regularly please go to the BreakoutWatch.com site and enter as a Guest. You will then be able to register to receive the newsletter.
Copyright © 2009 NBIcharts, LLC dba BreakoutWatch.com.
All rights reserved.
"
BreakoutWatch," the BreakoutWatch.com "eye" logo, and the
slogan "tomorrow's breakouts today" are service marks of NBIcharts
LLC. All other marks are the property of their respective owners, and are
used for descriptive purposes only.
BreakoutWatch is not affiliated with Investor's Business Daily or with Mr. William O'Neil.
Our site, research and analysis is supported entirely by subscription and is free from advertising.