| Market Summary | Weekly Breakout Report | Top Breakout Choices | Top 2nd Chances | New Features | Tip of the Week |
For new readers, we recall that we
focus on the NASDAQ Composite in our
weekly remarks because it is stocks listed on that exchange that
deliver the best breakout performance.
Although the primary trend
continues to be upwards, it is clear that
the trend has weakened considerably since the last mini-rally in
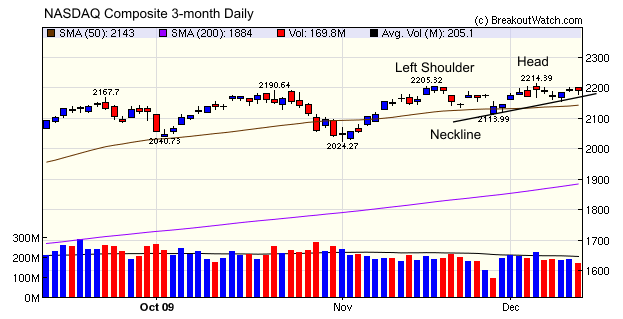
November. The NASDAQ Composite is again showing signs of weakness with the
possibility that a head and shoulders pattern is developing. The chart
shows the head and left shoulder and the right shoulder (not shown) may
have been set by the intraday high on Thursday of this week. If so,
then the neckline will be as shown. It will take a couple or so sessions
to confirm the right shoulder but by then the neckline may have been
broken which would confirm the pattern. Completed head and shoulders
patterns are generally bearish, so if completed we could see the
current consolidation pattern turn into a correction. This would be
confirmed with a break of the 50 dma line and a failure of support at
2114.
The chart also shows how average
volume has declined since November as
daily volume has been below average everyday, with only one exception
on December 4. Although low volume is considered a sign of a
technically weak market, the lack of volume makes it difficult to
assess the strength of a move in either direction.

Our
Zacks Strong Buy backtest data has been updated with the latest
available data from Zacks. The data is now current through November 13,
2009.
A
winning strategy: HTF breakouts and
Zacks Strong Buy (ZSB)
Back in May, we introduced a new
watchlist based on stocks that have a
"Strong Buy" rating from Zacks Investment Research. Backtesting a
strategy of buying breakouts from our cup-with-handle watchlist as they
broke out and then selling when they lost their Zacks "Strong Buy"
ranking showed very impressive returns of over 1000% since 2003. We
wrote about this strategy in detail in our white paper "Earnings
Revisions and Cup-with-Handle Breakouts: A Rewarding Combination".
Since the introduction of the
strategy, we have been somewhat
disappointed in the performance of ZSB breakouts from the
cup-with-handle pattern. In fact, they have generally performed poorly
showing a "pop" on breakout day but poor performance thereafter. In
contrast, ZSB breakouts from the High Tight Flag (HTF) pattern have
done extremely well, provided a
tight stop loss strategy was followed.
As we know, volatility was high
for much of the year as nervous traders
and investors were quick to open positions for fear of missing the new
bull market but were quick to close their positions for fear of being
caught by a failed bear market rally. In this volatile market, the use
of tight stops was essential to turn a profit. We can demonstrate this
with the help of or ZSB backtest tool.
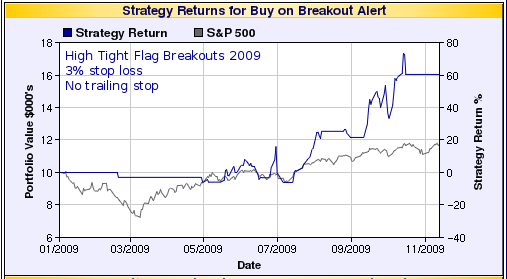
Chart1 shows the results of
applying our ZSB strategy to HTF breakouts
this year using a stop loss of 3% from the buy price as recommended in
our white paper. No trailing stop was used. The chart shows that the
strategy beat the S&P 500 by a factor of over 3.

Chart 1: HTF ZSB Breakouts 2009 - No Trailing Stop
Notice that results are marked by
strong
gains followed by steep losses, in several cases giving up all or most
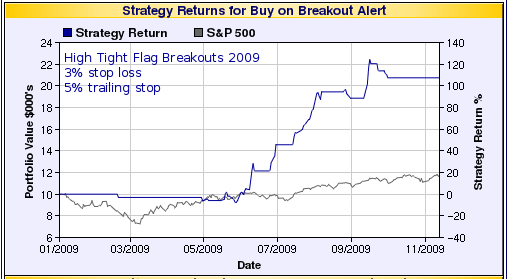
of the gains made. This implies that we need a trailing stop to limit
our losses. (A trailing stop is one which closes a position when the
stock falls by the trailing stop % from the previous high). Using a
trailing stop of 5% would have substantially improved our performance
as the next chart shows.

Chart 2: HTF ZSB Breakouts 2009 - 5% Trailing Stop

Chart 2: HTF ZSB Breakouts 2009 - 5% Trailing Stop
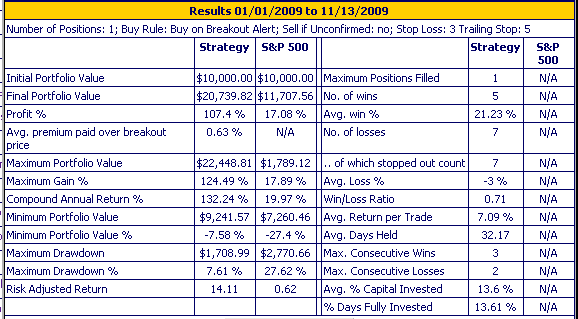
The next table shows in more
detail how
the strategy would have performed. Note that the overall return was
107% compared to the S&P 500's return year-to-date of 17%. With any
trading strategy, it is important to limit your drawdown. In this case
the drawdown was just 7.6%.


These are historical returns, of
course,
and there is no guarantee that the results will be similar in future.
Nevertheless, the use of backtesting tools can give valuable insights.
Our backtesting tools (for both the ZSB watchlist and our other
watchlists) allow you to test what has worked in the market recently
and allow you to detect when strategies that once worked well, are no
longer performing.
Our Zacks Strong Buy backtest tool is available to everyone to try at http://www.breakoutwatch.com/zacks/strategyTest.php. The results presented here for 2009 are not even the best that could have been obtained. Try the backtest tool yourself and see if you can do better!
Our Zacks Strong Buy backtest tool is available to everyone to try at http://www.breakoutwatch.com/zacks/strategyTest.php. The results presented here for 2009 are not even the best that could have been obtained. Try the backtest tool yourself and see if you can do better!
| Index | Value | Change Week | Change YTD | Trend | ||||||||||||||||||||||||||||||||||||
|---|---|---|---|---|---|---|---|---|---|---|---|---|---|---|---|---|---|---|---|---|---|---|---|---|---|---|---|---|---|---|---|---|---|---|---|---|---|---|---|---|
| Dow | 10471.5 | 0.8% | 19.31% | Up | ||||||||||||||||||||||||||||||||||||
| NASDAQ | 2190.31 | -0.18% | 38.89% | Up | ||||||||||||||||||||||||||||||||||||
| S&P 500 | 1106.41 | 0.04% | 22.49% | Up | ||||||||||||||||||||||||||||||||||||
| Russell 2000 | 600.37 | -0.4% | 20.21% | Up | ||||||||||||||||||||||||||||||||||||
| Wilshire 5000 | 11344.4 | 0.05% | 24.84% | Up | ||||||||||||||||||||||||||||||||||||
1The Market Signal is derived
from our proprietary market model. The market model is described on the
site.
2The site also shows industry rankings based on fundamentals, combined technical and fundamentals, and on price alone. The site also shows daily industry movements. |
||||||||||||||||||||||||||||||||||||||||
|
# of Breakouts
|
Period Average1
|
Max. Gain During Period2
|
Gain at Period Close3
|
|
|---|---|---|---|---|
| This Week | 5 | 9.92 | 10.47% | 4.78% |
| Last Week | 14 | 10.77 | 10.62% | 4.19% |
| 13 Weeks | 136 | 11.08 | 14.37% |
0.88% |
2This represents the return if each stock were bought at its breakout price and sold at its intraday high.
3This represents the return if each stock were bought at its breakout price and sold at the most recent close.
|
Category
|
Symbol
|
Company Name
|
Expected Gain1
|
|---|---|---|---|
| Best Overall | SFN | Spherion Corporation | 104 |
| Top Technical | GMK | Gruma Sa De Cv Ads | 88 |
| Top Fundamental | CHBT | China-Biotics, Inc. | 64 |
| Top Tech. & Fund. | STAR | Starent Networks | 26 |
|
Category
|
Symbol
|
Company Name
|
Expected Gain1
|
|---|---|---|---|
| Best Overall | GPOR | Gulfport Energy Corp | 77 |
| Top Technical | GPOR | Gulfport Energy Corp | 77 |
| Top Fundamental | CRNT | Ceragon Networks Ltd | 61 |
| Top Tech. & Fund. | CRNT | Ceragon Networks Ltd | 61 |
If you received this newsletter from a friend and you would like to receive it regularly please go to the BreakoutWatch.com site and enter as a Guest. You will then be able to register to receive the newsletter.
Copyright © 2009 NBIcharts, LLC dba BreakoutWatch.com. All
rights reserved.
" BreakoutWatch," the BreakoutWatch.com "eye" logo, and the slogan
"tomorrow's breakouts today" are service marks of NBIcharts LLC. All
other marks are the property of their respective owners, and are used
for descriptive purposes only.
BreakoutWatch is not affiliated with Investor's Business Daily
or with Mr. William O'Neil.
Our site, research and analysis is supported entirely by subscription
and is free from advertising.