| Market Summary | Weekly Breakout Report | Top Breakout Choices | Top 2nd Chances | New Features | Tip of the Week |
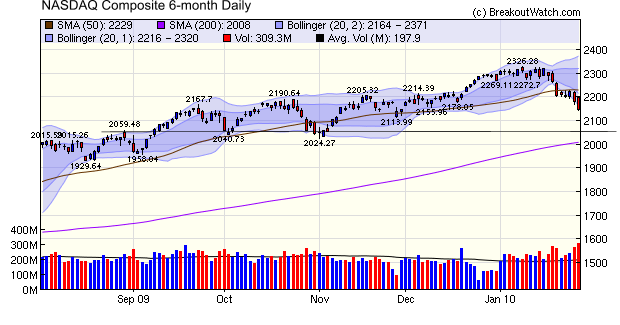
The NASDAQ Composite has corrected 8% from its high at the beginning of the year and has now fallen through 4 support levels. The next support level is at 2059 which would represent a 12% correction. The markets went up too quickly and it looks as though the correction is now underway. .It was surely significant that the markets could not stay positive after Friday's GDP numbers and a reported improvement in consumer confidence to the highest level in two years by the University of Michigan. Also significant was a fall in Microsoft despite beating earnings estimates. It looks as though there is more pain to come.

No new features this week.
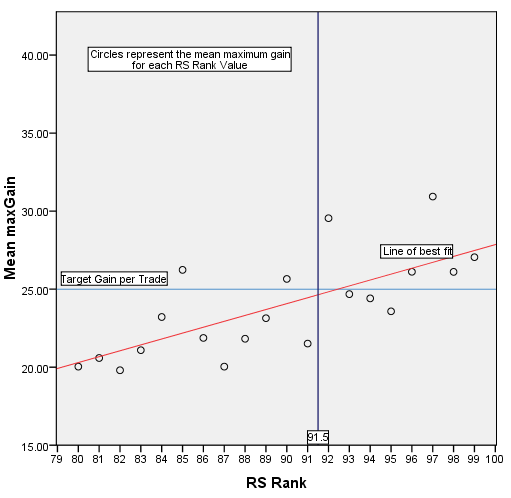
We return again to our examination of the factors that contribute to a successful breakout. (Which we defined as providing the potential for a gain of at least 25%). We noted last week that we had heard from a subscriber who only considers breakouts with an RS Rank level of 99 but after reading our analysis of RS Rank two weeks ago is considering switching to considering RS Rank levels of 91 or above. We promised to examine that scenario more closely and that's what we do today.
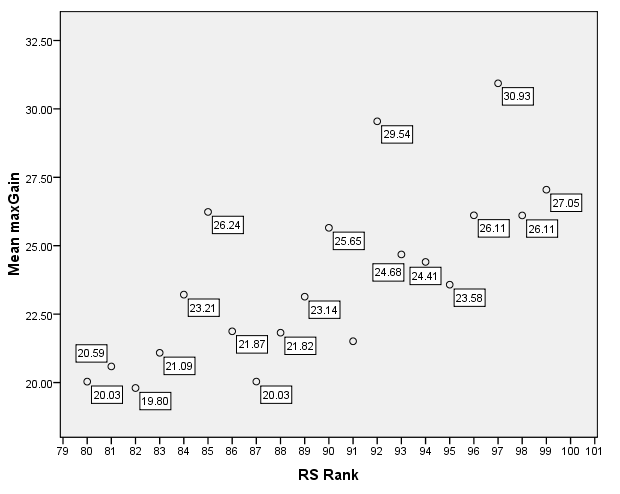
While resuming our analysis last week we found that some cases were missing from the data set we were working with and we have since done a new extraction which slightly alters our results of two weeks ago. Here is a scatter plot of mean maximum gain after breakout compared to RS Rank. The total number of breakouts considered is 3261 going back to January, 2004 (we only consider RS Rank of 80 and above and volumes on breakout day of 150% of average volume).

To
understand what the chart means for our trading prospects, we look at a
tabulation of the number of observations in each of our cut-off points.
| RS Rank | |||||
| <= 91 | >=92 | Total | |||
| max gain | >= 25% | Count | 1515 | 730 | 2245 |
| % of Total | 46.50% | 22.40% | 68.80% | ||
| < 25% | Count | 653 | 363 | 1016 | |
| % of Total | 20.00% | 11.10% | 31.20% | ||
| Total | Count | 2168 | 1093 | 3261 | |
| % of Total | 66.50% | 33.50% | 100.00% | ||
| Mean max gain | 22.20% | 26.40% | |||
We see that if traded on breakouts with an RS Rank of 92 or above, without any additional filtering criteria, we would have entered 1093 positions for an average maximum possible gain of 26.4%. Over the five years covered by our data, that would be approximately 200 trades per year, way to many for most of us. Let us look then at our subscriber's decision to trade only breakouts with an RS Rank of 99.
| RS Rank | |||||
| <= 98 | 99 | Total | |||
| max gain | >= 25% | Count | 2188 | 57 | 2245 |
| % of Total | 67.10% | 1.70% | 68.80% | ||
| < 25% | Count | 991 | 25 | 1016 | |
| % of Total | 30.40% | 0.80% | 31.20% | ||
| Total | Count | 3179 | 82 | 3261 | |
| % of Total | 97.50% | 2.50% | 100.00% | ||
| Mean max gain | 23.50% | 27.10% | |||
Now we would trade an average of under 20 positions a year for an average maximum gain of 27.1%.
We conclude that if the decision to enter a position is based on RS rank value alone, then a choice of an RS Rank Value of 99 is a very good one. However, the data would suggest that an RS Rank of 97 could be a better choice.

| Index | Value | Change Week | Change YTD | Trend | ||||||||||||||||||||||||||||||||||||
|---|---|---|---|---|---|---|---|---|---|---|---|---|---|---|---|---|---|---|---|---|---|---|---|---|---|---|---|---|---|---|---|---|---|---|---|---|---|---|---|---|
| Dow | 10067.3 | -1.04% | -3.46% | Up | ||||||||||||||||||||||||||||||||||||
| NASDAQ | 2147.35 | -2.63% | -5.37% | Down | ||||||||||||||||||||||||||||||||||||
| S&P 500 | 1073.87 | -1.64% | -3.7% | Up | ||||||||||||||||||||||||||||||||||||
| Russell 2000 | 602.04 | -2.44% | -5.05% | Down | ||||||||||||||||||||||||||||||||||||
| Wilshire 5000 | 11099.4 | -1.68% | -3.46% | Up | ||||||||||||||||||||||||||||||||||||
1The Market Signal is derived from our proprietary
market model. The market model is described on the site. 2The site also shows industry rankings based on fundamentals, combined technical and fundamentals, and on price alone. The site also shows daily industry movements. |
||||||||||||||||||||||||||||||||||||||||
# of Breakouts |
Period Average1 |
Max. Gain During Period2 |
Gain at Period Close3 |
|
|---|---|---|---|---|
| This Week | 10 | 11.69 | 6.58% | 1.75% |
| Last Week | 9 | 11.31 | 1.71% | -7.5% |
| 13 Weeks | 172 | 12 | 14.24% |
-3.45% |
2This represents the return if each stock were bought at its breakout price and sold at its intraday high.
3This represents the return if each stock were bought at its breakout price and sold at the most recent close.
Category |
Symbol |
Company Name |
Expected Gain1 |
|---|---|---|---|
| Best Overall | HOO | Cascal N V | 108 |
| Top Technical | JAZZ | Jazz Pharmaceuticals, Inc. | 77 |
| Top Fundamental | VIT | VanceInfo Technologies Inc. | 64 |
| Top Tech. & Fund. | VIT | VanceInfo Technologies Inc. | 64 |
Category |
Symbol |
Company Name |
Expected Gain1 |
|---|---|---|---|
| Best Overall | BLC | Belo Corp. | 109 |
| Top Technical | BLC | Belo Corp. | 109 |
| Top Fundamental | IGTE | iGate Corporation | 68 |
| Top Tech. & Fund. | IGTE | iGate Corporation | 68 |
If you received this newsletter from a friend and you would like to receive it regularly please go to the BreakoutWatch.com site and enter as a Guest. You will then be able to register to receive the newsletter.
Copyright © 2010 NBIcharts, LLC dba BreakoutWatch.com.
All rights reserved.
"
BreakoutWatch," the BreakoutWatch.com "eye" logo, and the
slogan "tomorrow's breakouts today" are service marks of NBIcharts
LLC. All other marks are the property of their respective owners, and are
used for descriptive purposes only.
BreakoutWatch is not affiliated with Investor's Business Daily or with Mr. William O'Neil.
Our site, research and analysis is supported entirely by subscription and is free from advertising.