| Market Summary | Weekly Breakout Report | Top Breakout Choices | Top 2nd Chances | New Features | Tip of the Week |
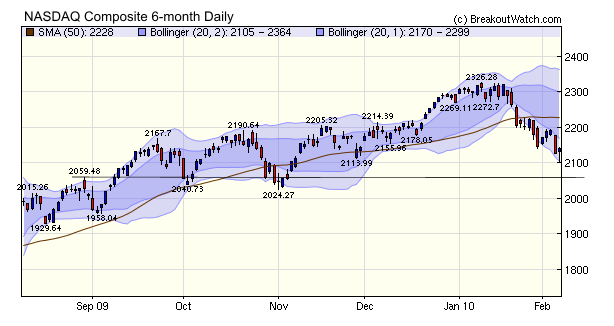
The markets were initially unimpressed with the latest employment numbers and still fretted over the financial condition of the PIGS (Portugal, Ireland, Greece and Spain) so the slide continued on Friday until mid-afternoon when a massive rally allowed the DJI, S&P 500 and NASDAQ Composite indexes to close with an accumulation day. The reason given for the rally was fear of being short over the weekend if the European Union announced supporting measures, and reasons for optimism in the employment numbers which showed 11,000 manufacturing jobs created in January.
Friday's intraday bottom with a higher close could be considered the first day of a possible rally. We should wait for a follow through day beginning as early as next Wednesday before considering the current slide is over. We anticipated last week that the NASDAQ could correct by 12% to around the 2060 level and that can't be ruled out yet.

No new features this week.
We showed previously (Newsletter 01/09/2010) that while daily volume at breakout is helpful, it must be at least 2.25 times average daily volume to be a useful factor in selecting a breakout to trade.
We went on to show (01/16/2010 and 01/30/2010) that RS rank values above 92 were very helpful in selecting breakouts that exceeded our target.
This week we look at the contribution of CEF, Rank in Industry and Industry Rank.
CEF
Our CEF metric is the result of measuring a stock's performance on eleven measures of fundamental performance to give a maximum possible score of 11points which we normalize on a scale of 1-5. The methodology is described here.
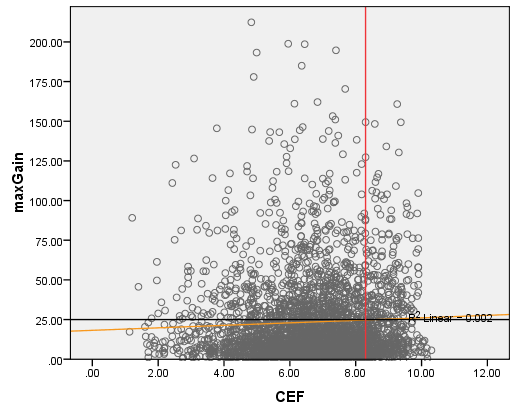
We find an analysis of scatter plots useful in giving a visual presentation of the degree to which there is a relationship between maximum gain after breakout and any one variable. Here is the plot of max gain against CEF score.

The orange line is the line of best fit (regression) through the data and we see it intersects our target 25% max gain at about CEF 8.3 (or 5 on our normalized scale used in our watchlists). While the slope of the line shows there is a positive relationship between CEF and max. gain, a statistical analysis shows that the relationship is weak. While it may be tempting to assume that CEF scores greater than 8.3 would help us select breakouts that will meet our target, there are several points to make about this plot.
- Our sample is drawn from stocks that have an RS Rank of at least 80 on the day before breakout. They are further filtered by the act of breaking out.
- The wide dispersion evident in CEF values for these stocks that have broken out, shows that CEF in itself is a poor selector of the potential to breakout.
- The shallow slope of the regression line shows that CEF is of only partial help in selecting stocks after they have broken out.
Rank in Industry
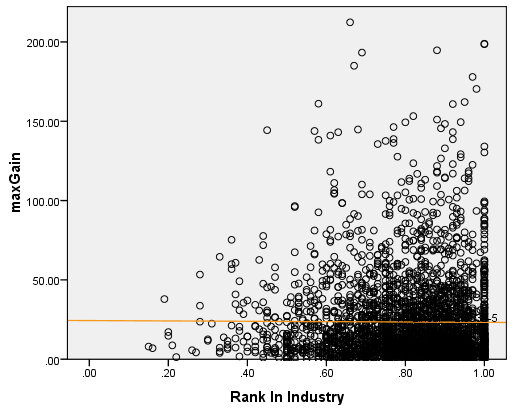
We rank stocks in their industry group according to their RS Rank on a scale of 0 to 1. Here is the scatter plot of max. gain vs. Rank in Industry.

We see that stocks with a higher Rank In Industry are better represented in our sample, which shows that higher rank in industry makes a stock more likely to breakout. However, the flat regression line shows that there is no relationship between Rank in Industry and performance after breakout. We therefore conclude that Rank in Industry is not useful for selecting stocks to meet our target after breakout.
Industry Rank
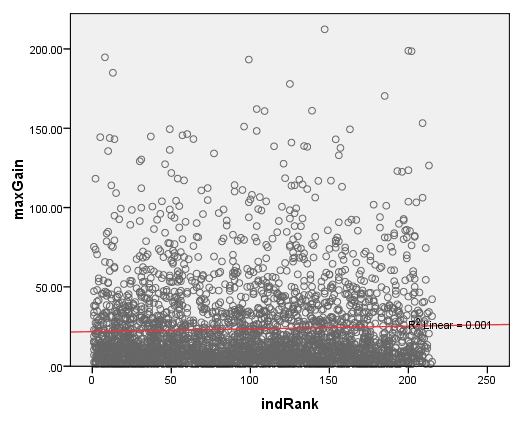
We rank industries based on the mean technical score (CET) of stocks within the industry. There are 225 industry groups ranked from 1 (best) to 225 (worst). Here's the scatter plot for max. gain versus Industry Rank.

We see that all industry ranks are more or less equally represented in our sample so industry rank is not useful in predicting which stocks are more likely to breakout. Furthermore, we see that the regression line is again flat, so Industry Rank is also not useful in determining likely performance after breakout.
| Index | Value | Change Week | Change YTD | Trend | ||||||||||||||||||||||||||||||||||||
|---|---|---|---|---|---|---|---|---|---|---|---|---|---|---|---|---|---|---|---|---|---|---|---|---|---|---|---|---|---|---|---|---|---|---|---|---|---|---|---|---|
| Dow | 10012.2 | -0.55% | -3.99% | Up | ||||||||||||||||||||||||||||||||||||
| NASDAQ | 2141.12 | -0.29% | -5.64% | Down | ||||||||||||||||||||||||||||||||||||
| S&P 500 | 1066.18 | -0.72% | -4.39% | Up | ||||||||||||||||||||||||||||||||||||
| Russell 2000 | 592.98 | -1.5% | -6.48% | Down | ||||||||||||||||||||||||||||||||||||
| Wilshire 5000 | 11005.5 | -0.85% | -4.28% | Up | ||||||||||||||||||||||||||||||||||||
1The Market Signal is derived from our proprietary
market model. The market model is described on the site. 2The site also shows industry rankings based on fundamentals, combined technical and fundamentals, and on price alone. The site also shows daily industry movements. |
||||||||||||||||||||||||||||||||||||||||
# of Breakouts |
Period Average1 |
Max. Gain During Period2 |
Gain at Period Close3 |
|
|---|---|---|---|---|
| This Week | 7 | 11.85 | 7.62% | 0.11% |
| Last Week | 17 | 11.69 | 4.36% | -4.4% |
| 13 Weeks | 182 | 12.23 | 13.24% |
-4.81% |
2This represents the return if each stock were bought at its breakout price and sold at its intraday high.
3This represents the return if each stock were bought at its breakout price and sold at the most recent close.
Category |
Symbol |
Company Name |
Expected Gain1 |
|---|---|---|---|
| Best Overall | CROX | CROCS Inc. | 107 |
| Top Technical | EK | Eastman Kodak Co. | 107 |
| Top Fundamental | UTI | Universal Technical Institute Inc. | 52 |
| Top Tech. & Fund. | UTI | Universal Technical Institute Inc. | 52 |
Category |
Symbol |
Company Name |
Expected Gain1 |
|---|---|---|---|
| Best Overall | CLS | Celestica Inc. | 68 |
| Top Technical | THO | Thor Industries Inc. | 40 |
| Top Fundamental | THO | Thor Industries Inc. | 40 |
| Top Tech. & Fund. | THO | Thor Industries Inc. | 40 |
If you received this newsletter from a friend and you would like to receive it regularly please go to the BreakoutWatch.com site and enter as a Guest. You will then be able to register to receive the newsletter.
Copyright © 2010 NBIcharts, LLC dba BreakoutWatch.com.
All rights reserved.
"
BreakoutWatch," the BreakoutWatch.com "eye" logo, and the
slogan "tomorrow's breakouts today" are service marks of NBIcharts
LLC. All other marks are the property of their respective owners, and are
used for descriptive purposes only.
BreakoutWatch is not affiliated with Investor's Business Daily or with Mr. William O'Neil.
Our site, research and analysis is supported entirely by subscription and is free from advertising.