| Market Summary | Weekly Breakout Report | Top Breakout Choices | Top 2nd Chances | New Features | Tip of the Week |
Our trend indicators have turned negative for all the major indexes except the DJI.
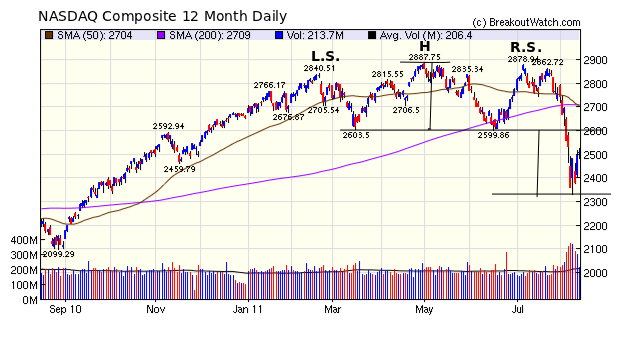
Last week we noted that the NASDAQ Composite had completed a head and shoulders top and that the target cover price, based on the distance between the neckline and the head, was around 2310*. In fact, the low this week was set on Tuesday at 2332, quite close to the predicted target. Whether or not this week's low represents a bottom is very much open to question.
While the markets almost certainly over-reacted to the global downturn, rumors of European bank insolvency and US debt downgrade, the prospects for the US and global economies in the short to medium term are weak. Barry Ritholz poses the question "Are we already in recession" and answers it by saying "Given yesterday’s data showing both imports and exports falling, we may have an implied Q2 GDP revised lower by 0.8% to 0.5% annualized growth - putting Q2 into the negative category." If so, then this week's bounce may prove to be of the dead cat variety and we may in fact be already in a bear market.

* In fact we said 2100 when we meant 2310. This was corrected in the online version of the newsletter.
No new features this week.
The volatility present in the market this week creates opportunities for very short term traders, but is a challenge for most of us as the indexes can move by hundreds of points in a few minutes. Only computers can compete in this trading environment. In fact, as this Bloomberg article shows, trading volumes tripled due to computer driven high frequency trading. I think it is better to stay on the sidelines until volatility returns to more normal levels.
| Index | Value | Change Week | Change YTD | Trend | ||||||||||||||||||||||||||||||||||||
|---|---|---|---|---|---|---|---|---|---|---|---|---|---|---|---|---|---|---|---|---|---|---|---|---|---|---|---|---|---|---|---|---|---|---|---|---|---|---|---|---|
| Dow | 11269 | -1.53% | -2.66% | Up | ||||||||||||||||||||||||||||||||||||
| NASDAQ | 2507.98 | -0.96% | -5.46% | Down | ||||||||||||||||||||||||||||||||||||
| S&P 500 | 1178.81 | -1.72% | -6.27% | Down | ||||||||||||||||||||||||||||||||||||
| Russell 2000 | 697.5 | -2.4% | -10.99% | Down | ||||||||||||||||||||||||||||||||||||
| Wilshire 5000 | 12367.6 | -1.57% | -6.94% | Down | ||||||||||||||||||||||||||||||||||||
1The Market Signal is derived from our proprietary
market model. The market model is described on the site. 2The site also shows industry rankings based on fundamentals, combined technical and fundamentals, and on price alone. The site also shows daily industry movements. |
||||||||||||||||||||||||||||||||||||||||
# of Breakouts |
Period Average1 |
Max. Gain During Period2 |
Gain at Period Close3 |
|
|---|---|---|---|---|
| This Week | 7 | 12.15 | 3.4% | 1% |
| Last Week | 75 | 12.62 | -2.09% | -10.27% |
| 13 Weeks | 287 | 13.15 | 6.53% |
-10.75% |
2This represents the return if each stock were bought at its breakout price and sold at its intraday high.
3This represents the return if each stock were bought at its breakout price and sold at the most recent close.
Category |
Symbol |
Company Name |
Expected Gain1 |
|---|---|---|---|
| Best Overall | NGD | New Gold Inc. (USA) | 70 |
| Top Technical | TMF | Direxion Daily 30-Yr Trsry Bull 3X Shrs | 38 |
| Top Fundamental | NGD | New Gold Inc. (USA) | 70 |
| Top Tech. & Fund. | NGD | New Gold Inc. (USA) | 70 |
Category |
Symbol |
Company Name |
Expected Gain1 |
|---|---|---|---|
| Best Overall | MFN | Minefinders Corp. Ltd. (USA) | 59 |
| Top Technical | MFN | Minefinders Corp. Ltd. (USA) | 59 |
| Top Fundamental | EGO | Eldorado Gold Corporation (USA) | 45 |
| Top Tech. & Fund. | MFN | Minefinders Corp. Ltd. (USA) | 59 |
If you received this newsletter from a friend and you would like to receive it regularly please go to the BreakoutWatch.com site and enter as a Guest. You will then be able to register to receive the newsletter.
Copyright © 2011 NBIcharts, LLC dba BreakoutWatch.com.
All rights reserved.
"
BreakoutWatch," the BreakoutWatch.com "eye" logo, and the
slogan "tomorrow's breakouts today" are service marks of NBIcharts
LLC. All other marks are the property of their respective owners, and are
used for descriptive purposes only.
BreakoutWatch is not affiliated with Investor's Business Daily or with Mr. William O'Neil.
Our site, research and analysis is supported entirely by subscription and is free from advertising.