| Market Summary | Weekly Breakout Report | Top Breakout Choices | Top 2nd Chances | New Features | Tip of the Week |
For the benefit of new subscribers, each week we focus on the NASDAQ Composite as it is from that exchange that most breakouts occur. The Russell 2000 is also a source of breakouts, but the index is more volatile (meaning more noise) than the NASDAQ, and so less useful as an indicator of market trend.
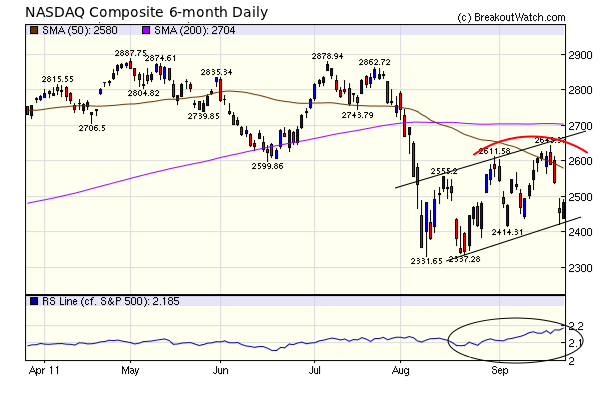
The NASDAQ market trend signal turned positive on August 29 and we can see from the chart that the index is trending upwards with higher highs and higher lows. At least it was until Wednesday this week, when the FOMC shattered expectations by failing to announce a new round of QE and issued a downbeat view of economic prospects. The markets inevitably over-reacted, as they usually do, by collapsing Wednesday afternoon and plunging on Thursday before Friday brought a relief rally. Where we go from here is anyone's guess, but there is a risk of a new head and shoulders top forming, as I've indicated on the chart with the red arc.
It can be argued that the NASDAQ is less subject to global influences than the larger cap indexes of the DJI and S&P 500 so we have included a chart of the relative strength of the NASDAQ vs the S&P 500 and you can see that since mid-August, the NASDAQ has been outperforming the S&P. The direction for the NASDAQ is therefore, more linked to domestic economic activity and a turnaround in the domestic economy would be positive for the NASDAQ even if the European crisis, with its threat the global financial system, continues.

The number of breakouts increased this week but the steep declines on Wednesday and Thursday left most of them under water or with only slight gains.
In contrast, taking a short position on our breakdown alerts would have netted over 9%.
| Brkdown Date |
Symbol | Base | Brkdown Price |
Last Close | Gain % at Last Close |
||
| 9/23/2011 | MAT | SS | 25.88 | 25.585 | 1.20% | ||
| 9/23/2011 | PCY | FB | 26.8 | 26.51 | 1.10% | ||
| 9/22/2011 | CAJ | FB | 43.01 | 43.28 | −0.60% | ||
| 9/22/2011 | DXJ | FB | 31.49 | 31.83 | −1.10% | ||
| 9/22/2011 | VIV | HS | 27.09 | 26.16 | 3.60% | ||
| 9/22/2011 | AUY | HS | 15.62 | 13.72 | 13.80% | ||
| 9/22/2011 | EGO | HS | 20.11 | 17.24 | 16.60% | ||
| 9/22/2011 | NSU | HS | 6.37 | 5.52 | 15.40% | ||
| 9/22/2011 | CAF | FB | 22.63 | 22.47 | 0.70% | ||
| 9/22/2011 | VPL | FB | 49.16 | 48.46 | 1.40% | ||
| 9/22/2011 | COG | SS | 70.03 | 61.11 | 14.60% | ||
| 9/22/2011 | PAAS | SS | 31.8 | 27.07 | 17.50% | ||
| 9/22/2011 | VIAB | SS | 45.4 | 40.68 | 11.60% | ||
| 9/22/2011 | APC | SS | 72.72 | 66.58 | 9.20% | ||
| 9/22/2011 | SGI | SS | 14.52 | 14.09 | 3.10% | ||
| 9/21/2011 | ELN | HS | 9.93 | 9.62 | 3.20% | ||
| 9/21/2011 | NWSA | HS | 16.75 | 16.11 | 4.00% | ||
| 9/20/2011 | CBOU | HS | 13.8 | 12.5 | 10.40% | ||
| 9/19/2011 | UNH | HS | 50.04 | 47.6 | 5.10% | ||
| 9/19/2011 | MNTA | SS | 17.43 | 11.47 | 52.00% | ||
| Average profit on Breakdowns | 9.14% | ||||||
You can see all recent breakdowns in our breakdown report on the site and also link to charts for each pattern.
Last week we introduced our new trend reversal signal (TRS) methodology and we have now substituted those trend reversal signals for the old market trend signals. We had considered keeping the two signals side by side as medium and short term trend indicators but have decided for simplicity to use the TRS only. They are shown on our daily market analysis page and email to subscribers and on this weekly newsletter below.
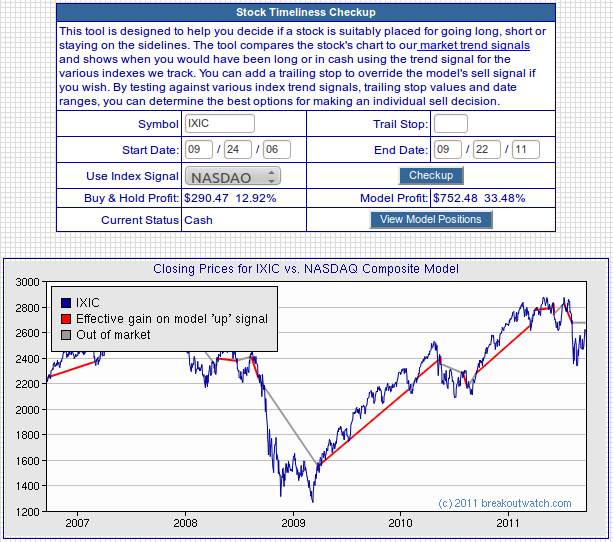
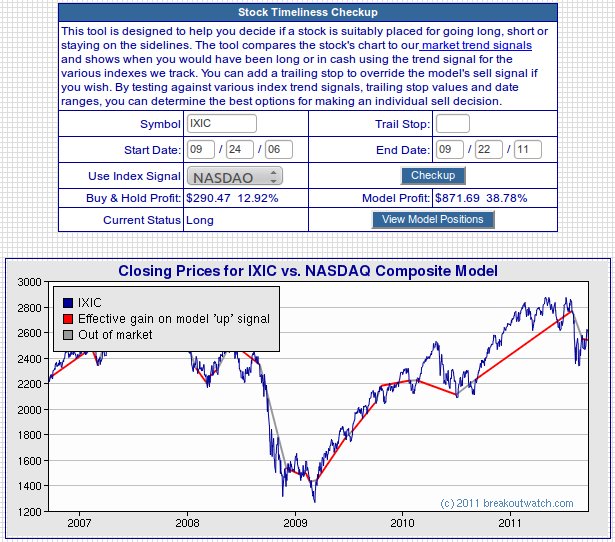
Our 'Stock Timeliness Checkup' tool (under the Analytical Tools menu) allows you to see how an investment in a particular stock would have fared had you entered and closed long positions in the stock based on the TRS. It can also be used to see how simply trading the index would have performed.
To demonstrate that the TRS indicators are an improvement over the old trend signals, we ran the Stock Timeliness Checkup tool using our symbol for the NASDAQ Composite (IXIC). Firstly, here's the results over the last five years using the old trend signals.
 Secondly, here are the results using the new TRS indicators.
As you can see, the new signals gave a 5% better return, that's a 15% improvement!.
So you can use the Stock Timeliness Checkup tool as a means to apply the TRS to any individual stock by using the appropriate index. The indexes for which we have TRS signals are the NASDAQ Composite (IXIC), Russell 2000 (RUT), S&P 500 (SPX), Dow Jones Industrials (DJI), and the Wilshire 5000 (DWC).
| Index | Value | Change Week | Change YTD | Trend | ||||||||||||||||||||||||||||||||||||
|---|---|---|---|---|---|---|---|---|---|---|---|---|---|---|---|---|---|---|---|---|---|---|---|---|---|---|---|---|---|---|---|---|---|---|---|---|---|---|---|---|
| Dow | 10771.5 | -6.41% | -6.96% | Down | ||||||||||||||||||||||||||||||||||||
| NASDAQ | 2483.23 | -5.3% | -6.39% | Up | ||||||||||||||||||||||||||||||||||||
| S&P 500 | 1136.43 | -6.54% | -9.64% | Down | ||||||||||||||||||||||||||||||||||||
| Russell 2000 | 652.43 | -8.66% | -16.74% | Up | ||||||||||||||||||||||||||||||||||||
| Wilshire 5000 | 11859.3 | -6.69% | -10.77% | Down | ||||||||||||||||||||||||||||||||||||
1The Market Signal is derived from our proprietary
market model. The market model is described on the site. 2The site also shows industry rankings based on fundamentals, combined technical and fundamentals, and on price alone. The site also shows daily industry movements. |
||||||||||||||||||||||||||||||||||||||||
# of Breakouts |
Period Average1 |
Max. Gain During Period2 |
Gain at Period Close3 |
|
|---|---|---|---|---|
| This Week | 19 | 12.92 | 3.66% | -1.72% |
| Last Week | 13 | 12.08 | 5.05% | -2.39% |
| 13 Weeks | 270 | 13.77 | 6.65% |
-11.69% |
2This represents the return if each stock were bought at its breakout price and sold at its intraday high.
3This represents the return if each stock were bought at its breakout price and sold at the most recent close.
Category |
Symbol |
Company Name |
Expected Gain1 |
|---|---|---|---|
| Best Overall | GNMK | GenMark Diagnostics, Inc | 108 |
| Top Technical | OXM | Oxford Industries, Inc. | 50 |
| Top Fundamental | AAPL | Apple Inc. | 28 |
| Top Tech. & Fund. | AAPL | Apple Inc. | 28 |
Category |
Symbol |
Company Name |
Expected Gain1 |
|---|---|---|---|
| Best Overall | ULTA | Ulta Salon, Cosmetics & Fragrance, Inc. | 56 |
| Top Technical | ULTA | Ulta Salon, Cosmetics & Fragrance, Inc. | 56 |
| Top Fundamental | CELG | Celgene Corporation | 26 |
| Top Tech. & Fund. | ULTA | Ulta Salon, Cosmetics & Fragrance, Inc. | 56 |
If you received this newsletter from a friend and you would like to receive it regularly please go to the BreakoutWatch.com site and enter as a Guest. You will then be able to register to receive the newsletter.
Copyright © 2011 NBIcharts, LLC dba BreakoutWatch.com.
All rights reserved.
"
BreakoutWatch," the BreakoutWatch.com "eye" logo, and the
slogan "tomorrow's breakouts today" are service marks of NBIcharts
LLC. All other marks are the property of their respective owners, and are
used for descriptive purposes only.
BreakoutWatch is not affiliated with Investor's Business Daily or with Mr. William O'Neil.
Our site, research and analysis is supported entirely by subscription and is free from advertising.