| Market Summary | Weekly Breakout Report | Top Breakout Choices | Top 2nd Chances | New Features | Tip of the Week |
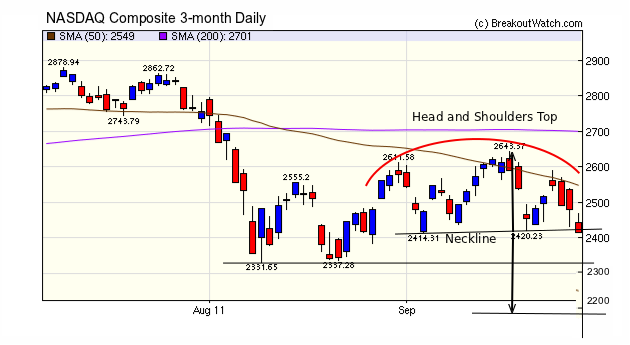
Last week we anticipated a possible head and shoulders top (HST) pattern forming for the NASDAQ Composite. This week saw the right shoulder form on Tuesday and the pattern was completed when the index closed below the neckline on Friday. The HST is one of the most reliable bearish continuation patterns as we discussed in our July 16, 2011 newsletter. The chart shows that there is the potential for support at around 2320 but the target price for this pattern is just below 2200, That's 10% below Friday's close and 30% below this year's high. (The target price is measured down from the neckline a distance equal to the distance from the neckline to the top).

Friday also saw the trend reversal signal for the NASDAQ turn bearish putting three of our signals on a downward trend.
There were 26 breakdowns this week compared to just 10 breakouts. This is another bearish indicator in addition to the chart above and our trend reversal signals.
At the request of a subscriber I have modified the Stock Timeliness tool to include the results for short positions.
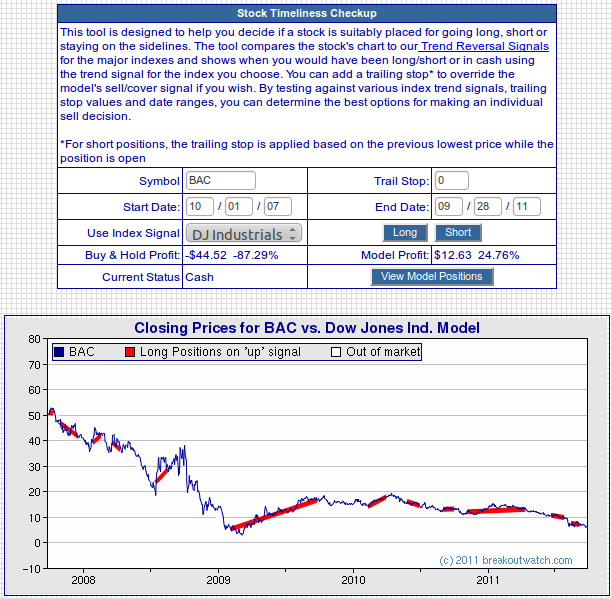
There is now a 'Long' button (see below) which will simulate opening a position when the trend is 'up' and closing it when the trend changes to down. Both the buy and sell prices are from the next day's open.
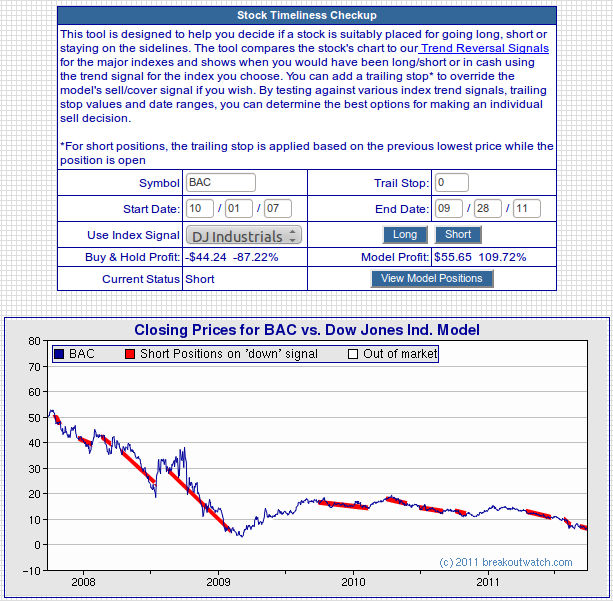
The 'Short' button simulates opening a short position when the trend is 'down' and covering the position when the trend turns to 'up'. Again, the next day's opening prices are used.
I was also asked to add the maximum drawdown in each case - I'll add that next week.
Example of Using the Stock Timeliness Checkup Tool for Short Positions
Here is an example of applying the Stock Timeliness tool to Bank of America (BAC) since October 1, 2007 until yesterday using the DJI Trend Reversal signals.
If you had traded BAC using long position reversals only you would have made 24% profit - not bad considering the stock lost 87%!

If, however, you had traded BAC using short positions only, you would have made 109%.


It is informative to use the tool
to compare the performance for a given stock against the different
index signals. Try it and have fun!
| Index | Value | Change Week | Change YTD | Trend | ||||||||||||||||||||||||||||||||||||
|---|---|---|---|---|---|---|---|---|---|---|---|---|---|---|---|---|---|---|---|---|---|---|---|---|---|---|---|---|---|---|---|---|---|---|---|---|---|---|---|---|
| Dow | 10913.4 | 1.32% | -5.74% | Down | ||||||||||||||||||||||||||||||||||||
| NASDAQ | 2415.4 | -2.73% | -8.95% | Down | ||||||||||||||||||||||||||||||||||||
| S&P 500 | 1131.42 | -0.44% | -10.04% | Up | ||||||||||||||||||||||||||||||||||||
| Russell 2000 | 644.16 | -1.27% | -17.8% | Up | ||||||||||||||||||||||||||||||||||||
| Wilshire 5000 | 11771.9 | -0.74% | -11.42% | Down | ||||||||||||||||||||||||||||||||||||
1The Market Signal is derived from our proprietary
market model. The market model is described on the site. 2The site also shows industry rankings based on fundamentals, combined technical and fundamentals, and on price alone. The site also shows daily industry movements. |
||||||||||||||||||||||||||||||||||||||||
# of Breakouts |
Period Average1 |
Max. Gain During Period2 |
Gain at Period Close3 |
|
|---|---|---|---|---|
| This Week | 10 | 12.15 | 4.08% | -1.89% |
| Last Week | 23 | 12.92 | 3.11% | -3.89% |
| 13 Weeks | 264 | 13.46 | 7.1% |
-12.4% |
2This represents the return if each stock were bought at its breakout price and sold at its intraday high.
3This represents the return if each stock were bought at its breakout price and sold at the most recent close.
Category |
Symbol |
Company Name |
Expected Gain1 |
|---|---|---|---|
| Best Overall | GUT | Gabelli Utility Trust | 106 |
| Top Technical | RTSA | iPath Short Extended Russell 2000 TR Index ETN&nbs | 48 |
| Top Fundamental | AAPL | Apple Inc. | 35 |
| Top Tech. & Fund. | AAPL | Apple Inc. | 35 |
Category |
Symbol |
Company Name |
Expected Gain1 |
|---|---|---|---|
| Best Overall | PMM | Putnam Managed Municipal Income Trust | 72 |
| Top Technical | BOM | Powershares DB Base Metals Double Short ETN & | 54 |
| Top Fundamental | BTA | BlackRock LT Municipal Advantage Trust | 49 |
| Top Tech. & Fund. | BTA | BlackRock LT Municipal Advantage Trust | 49 |
If you received this newsletter from a friend and you would like to receive it regularly please go to the BreakoutWatch.com site and enter as a Guest. You will then be able to register to receive the newsletter.
Copyright © 2011 NBIcharts, LLC dba BreakoutWatch.com.
All rights reserved.
"
BreakoutWatch," the BreakoutWatch.com "eye" logo, and the
slogan "tomorrow's breakouts today" are service marks of NBIcharts
LLC. All other marks are the property of their respective owners, and are
used for descriptive purposes only.
BreakoutWatch is not affiliated with Investor's Business Daily or with Mr. William O'Neil.
Our site, research and analysis is supported entirely by subscription and is free from advertising.