| Market Summary | Weekly Breakout Report | Top Breakout Choices | Top 2nd Chances | New Features | Tip of the Week |
Welcome to the New Year and what we hope will be a year in which the private investor regains faith in the markets, businesses invest some cash in their future and add to their human resources, and the economy continues to improve.
As always, we focus our attention on the NASDAQ market as that's where experience has shown that the most profitable breakouts come from.
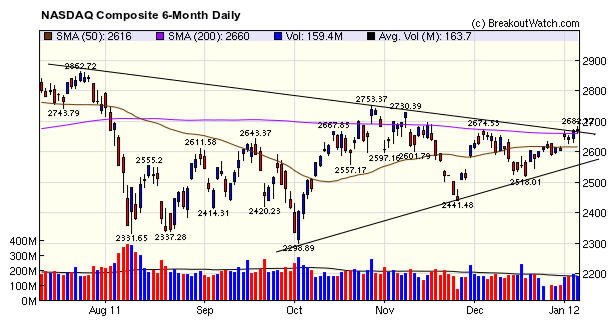
Our trend model for the NASDAQ shows an upward bias as the index begins to break out of a descending triangle pattern. The index attempted to break above the 200 dma on Tuesday but was stymied as it hit the descending resistance line. On Thursday the index rallied again with an accumulation day and on Friday the 200 dma provided support in early trading allowing the index to close the week with a healthy 2.7% gain. It is also encouraging to see volume for the week pickup although the volume trend overall is downward. We really need to see some above average volume to confirm the upward trend.
The number of confirmed breakouts (at the 150% ADV level) rose this week almost to the 13 week average level but the gains were a meager 2.4% by Friday's close. We consider the markets to be still fragile and that those who want to trade in this environment must be nimble.

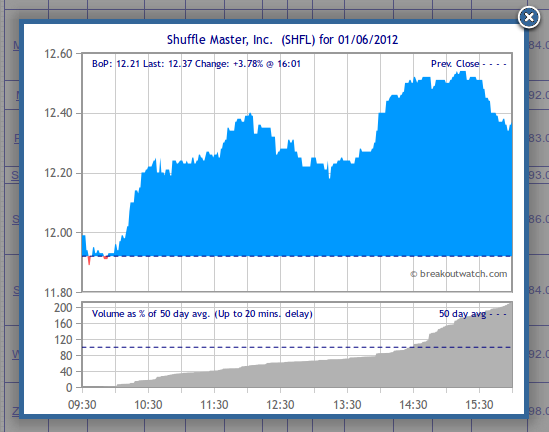
Our intraday charts are now available on both the 'Alerts Issued Today' page and the 'Alert Monitor'. The charts now include an intraday volume indicator, but note that the volume data can be up to 20 mins delayed. The volume data is shown as a % of the average daily volume so you can immediately see the the level of trading interest in the stock compared to the 50 day average.
We have also modified the email alert to include a link to the intraday chart.

More on the Intraday Chart and the Importance of Volume.
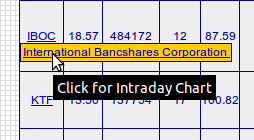
Access to the intraday charts has confused some subscribers so we explain again how to access them.
On each list the symbol gives you access to both a historical chart and the intraday chart. Clicking the symbol gives you access to the historical chart as it has always done. However, if you hover your mouse over the symbol a small pop-up appears with a link in it to the intraday chart, like this:

Importance of Volume
Although we consider a breakout to be successful if the volume on breakout day exceeds 150% of the 50 day average (the O'Neil criterion), our research has shown that breakouts with volume higher than 225% of the ADV have a greater probability of delivering higher returns (see Factors Contributing To Breakout Performance).
By placing a filter on the email alerts you will receive (this is done at the watchlist level) you can control at what volume level you will receive an alert. There are difficulties in using this knowledge however:
- If you wait until the actual volume has reached 225% of ADV, then the price will likely have moved well above the breakout price, causing you to lose some profit.
- If you buy when the breakout price is reached, regardless of volume, then the 225% volume level may not be reached that day.
| Index | Value | Change Week | Change YTD | Trend | ||||||||||||||||||||||||||||||||||||
|---|---|---|---|---|---|---|---|---|---|---|---|---|---|---|---|---|---|---|---|---|---|---|---|---|---|---|---|---|---|---|---|---|---|---|---|---|---|---|---|---|
| Dow | 12359.9 | 1.16% | 1.16% | Down | ||||||||||||||||||||||||||||||||||||
| NASDAQ | 2674.22 | 2.65% | 2.65% | Up | ||||||||||||||||||||||||||||||||||||
| S&P 500 | 1277.81 | 1.61% | 1.61% | Down | ||||||||||||||||||||||||||||||||||||
| Russell 2000 | 749.71 | 1.19% | 1.19% | Up | ||||||||||||||||||||||||||||||||||||
| Wilshire 5000 | 740.92 | -94.31% | -94.31% | Down | ||||||||||||||||||||||||||||||||||||
1The Market Signal is derived from our proprietary
market model. The market model is described on the site. 2The site also shows industry rankings based on fundamentals, combined technical and fundamentals, and on price alone. The site also shows daily industry movements. |
||||||||||||||||||||||||||||||||||||||||
# of Breakouts |
Period Average1 |
Max. Gain During Period2 |
Gain at Period Close3 |
|
|---|---|---|---|---|
| This Week | 26 | 22.85 | 3.74% | 2.39% |
| Last Week | 3 | 22.08 | 5.21% | -0.57% |
| 13 Weeks | 301 | 23.77 | 9.7% |
2.87% |
2This represents the return if each stock were bought at its breakout price and sold at its intraday high.
3This represents the return if each stock were bought at its breakout price and sold at the most recent close.
Category |
Symbol |
Company Name |
Expected Gain1 |
|---|---|---|---|
| Best Overall | EGAN | eGain Communications Corporation | 111 |
| Top Technical | RPTP | Raptor Pharmaceutical Corp. | 91 |
| Top Fundamental | RAX | Rackspace Hosting, Inc. | 39 |
| Top Tech. & Fund. | RAX | Rackspace Hosting, Inc. | 39 |
Category |
Symbol |
Company Name |
Expected Gain1 |
|---|---|---|---|
| Best Overall | WINN | Wynn Resorts, Limited | 69 |
| Top Technical | SHFL | Shuffle Master, Inc. | 56 |
| Top Fundamental | CLR | Continental Resources, Inc. | 38 |
| Top Tech. & Fund. | CLR | Continental Resources, Inc. | 38 |
If you received this newsletter from a friend and you would like to receive it regularly please go to the BreakoutWatch.com site and enter as a Guest. You will then be able to register to receive the newsletter.
Copyright © 2012 NBIcharts, LLC dba BreakoutWatch.com.
All rights reserved.
"
BreakoutWatch," the BreakoutWatch.com "eye" logo, and the
slogan "tomorrow's breakouts today" are service marks of NBIcharts
LLC. All other marks are the property of their respective owners, and are
used for descriptive purposes only.
BreakoutWatch is not affiliated with Investor's Business Daily or with Mr. William O'Neil.
Our site, research and analysis is supported entirely by subscription and is free from advertising.