| Market Summary | Weekly Breakout Report | Top Breakout Choices | Top 2nd Chances | New Features | Tip of the Week |
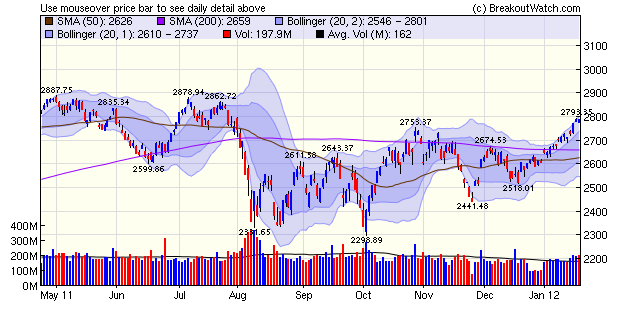
The NASDAQ Composite leaped over two resistance hurdles this week but Friday's minor retreat indicates traders are beginning to wonder if the the party is over, at least for now. The index has been marching up the channel between the 1 and 2 standard deviation Bollinger Bands and just crossed above the 2nd on Thursday which probably triggered programmed selling. Google's failure to meet earnings expectations held the index back on Friday. Now that the index is below the 2 SD line there seems no technical reason why the rally should not continue, at least until the strong resistance level at 2862-2878.

There may be fundamental reasons for a halt, however, Companies usually manage earnings expectations so well that more than 70% beat expectations, but that number has fallen to just over 50% this earnings season so we could see some of the air come out of the balloon.
No new features this week.
Recommended Cup with Handle Trading Strategy in Current Market Conditions
While volatility has decreased, and the level of concern over the European debt crisis has diminished somewhat, I think it useful to consider what trading strategy has been working since the recent market bottom in October.
My testing server gives me the opportunity to test many thousands of trading scenarios to find which one was optimum over the last 3 1/2 months and here are the results:
- Sell if the price drops by 4% from the breakout price. This is considerably tighter than has been previously recommended and is due to the rapid swings we have seen where the markets can move 2-3% up or down on consecutive days. There is often a reluctance to use tight stops for fear of missing a subsequent gain, but backtesting shows that cutting a loss short and moving on the next possible winner is the better strategy.
- Use a tight trailing stop of 2%. A trailing stop is a stop price based on the highest (intraday) price achieved since breakout. Take the money and run while you still have a profit.
- Breakouts that meet our Meets Target Criteria) MTC standard do
perform better overall than those that don't. As a reminder our MTC
criteria are shown below.
- Buy on breakout alert, if possible.
- Only buy when the NASDAQ market trend is up
- must be on our cup-with-handle watchlist
- Average daily volume >= 100,000
- Breakout price >= $6
- Relative Strength (RS) Rank >= 92
- CANTATA Fundamental Criterion #2 (CEF2) >= 0.6
- CANTATA Fundamental Criterion #3 (CEF3) >= 0.6
- must be in the top 25% of industry group rankings (that is, have an industry rank of less than 54)
| Index | Value | Change Week | Change YTD | Trend | ||||||||||||||||||||||||||||||||||||
|---|---|---|---|---|---|---|---|---|---|---|---|---|---|---|---|---|---|---|---|---|---|---|---|---|---|---|---|---|---|---|---|---|---|---|---|---|---|---|---|---|
| Dow | 12720.5 | 2.4% | 4.12% | Down | ||||||||||||||||||||||||||||||||||||
| NASDAQ | 2786.7 | 2.8% | 6.97% | Up | ||||||||||||||||||||||||||||||||||||
| S&P 500 | 1315.38 | 2.04% | 4.59% | Down | ||||||||||||||||||||||||||||||||||||
| Russell 2000 | 784.62 | 2.67% | 5.9% | Down | ||||||||||||||||||||||||||||||||||||
1The Market Signal is derived from our proprietary
market model. The market model is described on the site. 2The site also shows industry rankings based on fundamentals, combined technical and fundamentals, and on price alone. The site also shows daily industry movements. |
||||||||||||||||||||||||||||||||||||||||
# of Breakouts |
Period Average1 |
Max. Gain During Period2 |
Gain at Period Close3 |
|
|---|---|---|---|---|
| This Week | 22 | 25.46 | 4.77% | 2.38% |
| Last Week | 24 | 24.69 | 10.71% | 5.72% |
| 13 Weeks | 330 | 26.23 | 11.28% |
5.39% |
2This represents the return if each stock were bought at its breakout price and sold at its intraday high.
3This represents the return if each stock were bought at its breakout price and sold at the most recent close.
Category |
Symbol |
Company Name |
Expected Gain1 |
|---|---|---|---|
| Best Overall | NQ | NetQin Mobile Inc (ADR) | 114 |
| Top Technical | MBI | MBIA Inc. | 66 |
| Top Fundamental | RAX | Rackspace Hosting, Inc. | 46 |
| Top Tech. & Fund. | RAX | Rackspace Hosting, Inc. | 46 |
Category |
Symbol |
Company Name |
Expected Gain1 |
|---|---|---|---|
| Best Overall | LSCC | Lattice Semiconductor | 100 |
| Top Technical | EC | Ecopetrol S.A. (ADR) | 19 |
| Top Fundamental | OAS | Oasis Petroleum Inc. | 46 |
| Top Tech. & Fund. | OAS | Oasis Petroleum Inc. | 46 |
If you received this newsletter from a friend and you would like to receive it regularly please go to the BreakoutWatch.com site and enter as a Guest. You will then be able to register to receive the newsletter.
Copyright © 2012 NBIcharts, LLC dba BreakoutWatch.com.
All rights reserved.
"
BreakoutWatch," the BreakoutWatch.com "eye" logo, and the
slogan "tomorrow's breakouts today" are service marks of NBIcharts
LLC. All other marks are the property of their respective owners, and are
used for descriptive purposes only.
BreakoutWatch is not affiliated with Investor's Business Daily or with Mr. William O'Neil.
Our site, research and analysis is supported entirely by subscription and is free from advertising.