| Market Summary | Weekly Breakout Report | Top Breakout Choices | Top 2nd Chances | New Features | Tip of the Week |
Please read this week's Top Tip as it has important implications for real time traders
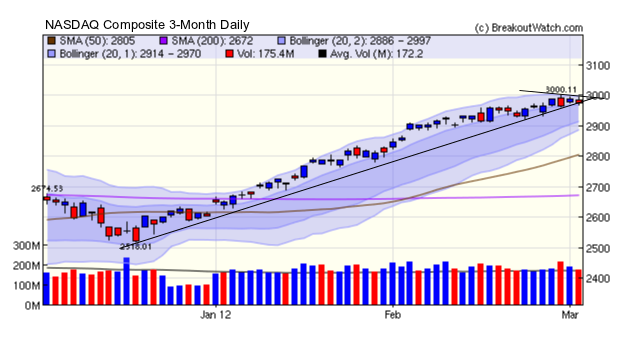
The NASDAQ Composite is showing early signs of entering a bearish descending triangle pattern. It is too early to confirm this, but the warning signs are there. Last week, we drew attention to the almost equal balance between bulls and bears as represented by the predominance of doji candlestick patterns, and although the index did move higher on Tuesday, Wednesday's heavy distribution day was a shot across the bows for the bulls. Note also, that the Bollinger Bands are tightening indicating the price movements are narrowing. With oil prices rising and the mounting tension over Iran, particularly now the President has made a strong statement that almost certainly locks him into military action if sanctions fail to produce a climb-down by Iran (very unlikely), the positive aspects of an improving economy are likely to be outweighed by the mounting uncertainty.

No new features this week.
Important Information about Real Time Alerts
When the NASDAQ changed its rules about the distribution of real time trade information, which coincided with a steep drop-off in subscriptions after the market crash, we had to find another source of real time data and built a feed based on Google's price data, which is supposedly real-time, while their volume data is at least 15 minutes delayed. Consequently, we started issuing alerts when the breakout price (BoP) was reached and dropped the previous requirement that projected volume be at least 1.5 times average daly volume (ADV). In theory, that should have meant that alerts were issued earlier in the session as we were not waiting for the volume condition to be met.
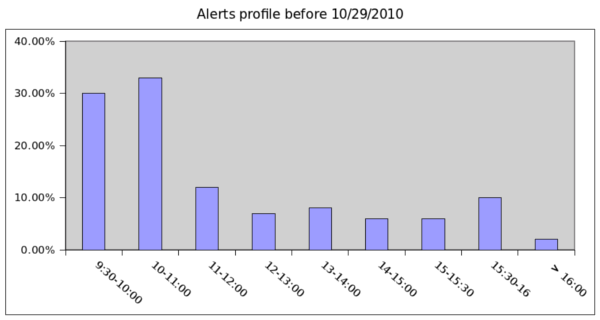
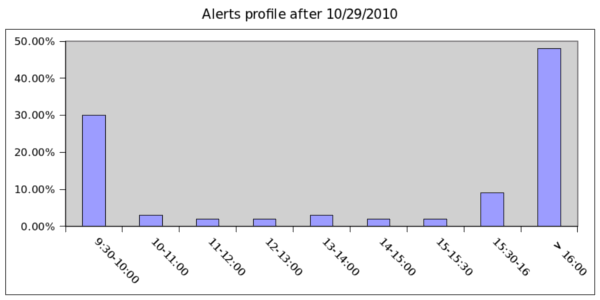
Recently, a subscriber wished to do an analyis of the times when breakout alerts are issued which are then confirmed at the end of the session (meaning that their price met or exceeded the BoP). The results were surprising because they indicate that some of the real time data subsequent to 10/29/2010 were actually significantly delayed.
The next two charts compare the times of breakout alerts, which were subsequently confirmed, before and after 10/29/2010. You can see that in the second chart, a large number of alerts (48%) were actually received after 4pm (16:00). While we would expect some reporting delays, this is excessive and indicates that we were not receiving real time data. Note also that although trading is heavily concentrated at the start and end of the day, before 10/29/2010 there is a shift of alerts into the 10:00 - 11:00 time frame which is consistent with what we would expect if there was a delay while the necessary ADV requirment was met. Note also that very few alerts were issued after 4pm which is consistent with what we would expect for real-time data.
Quite frankly, this is embarrassing, but must be disclosed because the integrity of our data is so important to us. I am also grateful to the subscriber who prompted the analysis and brought this to light.
Over the weekend I will be setting up a new data feed. As you may know there are now many exchanges outside of the NASDAQ, NYSE and AMEX on which trading takes place, but where prices (but not volume) closely mirror those of the major exchanges. We will now move to a feed from the BATS exchange and at the end of the week we'll review the alert profiles again.


| Index | Value | Change Week | Change YTD | Trend | ||||||||||||||||||||||||||||||||||||
|---|---|---|---|---|---|---|---|---|---|---|---|---|---|---|---|---|---|---|---|---|---|---|---|---|---|---|---|---|---|---|---|---|---|---|---|---|---|---|---|---|
| Dow | 12977.6 | -0.04% | 6.22% | Down | ||||||||||||||||||||||||||||||||||||
| NASDAQ | 2976.19 | 0.42% | 14.24% | Up | ||||||||||||||||||||||||||||||||||||
| S&P 500 | 1369.63 | 0.28% | 8.91% | Up | ||||||||||||||||||||||||||||||||||||
| Russell 2000 | 802.42 | -2.96% | 8.3% | Down | ||||||||||||||||||||||||||||||||||||
1The Market Signal is derived from our proprietary
market model. The market model is described on the site. 2The site also shows industry rankings based on fundamentals, combined technical and fundamentals, and on price alone. The site also shows daily industry movements. |
||||||||||||||||||||||||||||||||||||||||
# of Breakouts |
Period Average1 |
Max. Gain During Period2 |
Gain at Period Close3 |
|
|---|---|---|---|---|
| This Week | 19 | 25.69 | 5.43% | 0.04% |
| Last Week | 21 | 27 | 8.75% | 2.95% |
| 13 Weeks | 329 | 28.77 | 11.7% |
3.96% |
2This represents the return if each stock were bought at its breakout price and sold at its intraday high.
3This represents the return if each stock were bought at its breakout price and sold at the most recent close.
Category |
Symbol |
Company Name |
Expected Gain1 |
|---|---|---|---|
| Best Overall | SMBL | Smart Balance Inc | 123 |
| Top Technical | SVVC | Firsthand Technology Value Fund, Inc. | 55 |
| Top Fundamental | GOLD | Randgold Resources Limited | 33 |
| Top Tech. & Fund. | CERN | Cerner Corporation | 38 |
Category |
Symbol |
Company Name |
Expected Gain1 |
|---|---|---|---|
| Best Overall | NQ | NetQin Mobile Inc. | 108 |
| Top Technical | CQP | Cheniere Energy Partners, LP | 48 |
| Top Fundamental | TRS | TriMas Corporation | 55 |
| Top Tech. & Fund. | TRS | TriMas Corporation | 55 |
If you received this newsletter from a friend and you would like to receive it regularly please go to the BreakoutWatch.com site and enter as a Guest. You will then be able to register to receive the newsletter.
Copyright © 2012 NBIcharts, LLC dba BreakoutWatch.com.
All rights reserved.
"
BreakoutWatch," the BreakoutWatch.com "eye" logo, and the
slogan "tomorrow's breakouts today" are service marks of NBIcharts
LLC. All other marks are the property of their respective owners, and are
used for descriptive purposes only.
BreakoutWatch is not affiliated with Investor's Business Daily or with Mr. William O'Neil.
Our site, research and analysis is supported entirely by subscription and is free from advertising.