| Market Summary | Weekly Breakout Report | Top Breakout Choices | Top 2nd Chances | New Features | Tip of the Week |

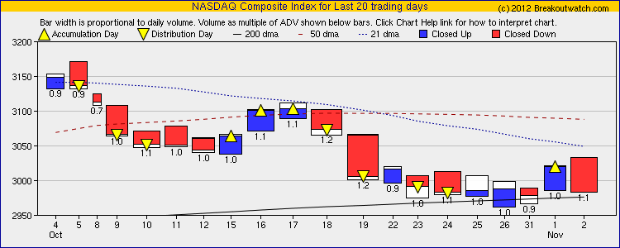
Our NASDAQ Composite trend indicator turned upwards on Thursday as the index recorded an accumulation day. The turn upwards came as the index continued to find support intraday at the 200 dma level while closing higher on Monday, Tuesday and Thursday. Our trend indicators for the S&P 500 and DJI remain negative. The NASDAQ is the more volatile index and the trend indicator is tuned to that volatility so it is typical that the NASDAQ indicator would turn before the other two.
It is difficult to assess the meaning of Friday's reversal which left the index in negative territory for the week. It could be due to profit taking, a potential hit to economic growth due to Hurricane Sandy's devastation or a reaction to the increase in the unemployment rate, In any case, one day's results do not make a statistic or identify a trend, so we prefer to believe that the trend is now upwards and the number of successful breakouts will increase, until there is more evidence to the contrary.
Note that although the number of successful breakouts fell this week compared to last week, the net return was a positive 2.6%.
No new features this week. If you haven't yet done so, take a look at our free facebook app. We are working on adapting this to mobile platforms.
How to Use the Stock Timeliness Checkup Tool
Now that the NASDAQ trend has turned upwards, how can we use that to determine which breakouts we should invest in?
Lets consider two stocks that are ranked highest on our cup-with-handle watchlist now, OMG and KTCC. Note that KTCC is a pure technology stock (computer peripherals) while OMG is purely retail.
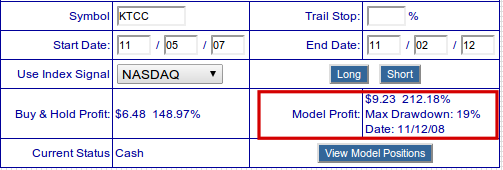
If we run the Stock Timeliness Tool over the last five years (which gives us a sample of bear and bull markets) we see that if we bought and sold (went long) OMG based on the NASDAQ trend indicator, we would have gained a return of 58% . In contrast, if we used the indicator to trade KTCC then we would have gained 212%.
This tells us that if we get a breakout alert on KTCC and OMG in the next day or so, we would probably be better served to invest in KTCC as it has historically made better gains when the NASDAQ has been in an uptrend.
The results of running the Stock Timeliness Checkup tool on each stock is shown in these two tables. You can see the details of the analysis by running the tool for yourself which is found under Evaluate > Analytical Tools.


| Index | Value | Change Week | Change YTD | Trend | ||||||||||||||||||||||||||||||||||||
|---|---|---|---|---|---|---|---|---|---|---|---|---|---|---|---|---|---|---|---|---|---|---|---|---|---|---|---|---|---|---|---|---|---|---|---|---|---|---|---|---|
| Dow | 13093.2 | -0.11% | 7.17% | Down | ||||||||||||||||||||||||||||||||||||
| NASDAQ | 2982.13 | -0.19% | 14.47% | Up | ||||||||||||||||||||||||||||||||||||
| S&P 500 | 1414.2 | 0.16% | 12.45% | Down | ||||||||||||||||||||||||||||||||||||
1The Market Signal is derived from our proprietary
market model. The market model is described on the site. 2The site also shows industry rankings based on fundamentals, combined technical and fundamentals, and on price alone. The site also shows daily industry movements. |
||||||||||||||||||||||||||||||||||||||||
# of Breakouts |
Period Average1 |
Max. Gain During Period2 |
Gain at Period Close3 |
|
|---|---|---|---|---|
| This Week | 24 | 20 | 5.26% | 2.64% |
| Last Week | 35 | 19 | 1.5% | -0.3% |
| 13 Weeks | 304 | 20.85 | 9.02% |
1.41% |
2This represents the return if each stock were bought at its breakout price and sold at its intraday high.
3This represents the return if each stock were bought at its breakout price and sold at the most recent close.
Category |
Symbol |
Company Name |
Expected Gain1 |
|---|---|---|---|
| Best Overall | HL | Hecla Mining Company | 97 |
| Top Technical | HL | Hecla Mining Company | 97 |
| Top Fundamental | TLLP | Tesoro Logistics LP | 45 |
| Top Tech. & Fund. | MGAM | Multimedia Games Holding Company Inc | 57 |
Category |
Symbol |
Company Name |
Expected Gain1 |
|---|---|---|---|
| Best Overall | UNXL | Uni-Pixel Inc(NDA) | 85 |
| Top Technical | UNXL | Uni-Pixel Inc(NDA) | 85 |
| Top Fundamental | DXPE | DXP Enterprises, Inc. | 52 |
| Top Tech. & Fund. | TRS | TriMas Corp | 54 |
If you received this newsletter from a friend and you would like to receive it regularly please go to the BreakoutWatch.com site and enter as a Guest. You will then be able to register to receive the newsletter.
Copyright © 2012 NBIcharts, LLC dba BreakoutWatch.com.
All rights reserved.
"
BreakoutWatch," the BreakoutWatch.com "eye" logo, and the
slogan "tomorrow's breakouts today" are service marks of NBIcharts
LLC. All other marks are the property of their respective owners, and are
used for descriptive purposes only.
BreakoutWatch is not affiliated with Investor's Business Daily or with Mr. William O'Neil.
Our site, research and analysis is supported entirely by subscription and is free from advertising.