| Market Summary | Weekly Breakout Report | Top Breakout Choices | Top 2nd Chances | New Features | Tip of the Week |
Our trend indicators for the major indexes remained at 'down' for the week. This comes as no surprise to my readers as we have been anticipating a consolidation for the last three weeks in this newsletter. Looking forward, a test of support at 3422 seems likely. If that level holds then a continued period of consolidation between 3420 and 3500 can be expected until the rally resumes.
You will note that I've added a 'slope' chart to the usual chart this week. This is a new feature so be sure to read about it below.

'Slope' Technical Indicator
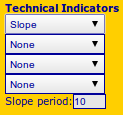
The new 'Slope' indicator is accessed from our Technical Analysis chart window.
 When you select 'Slope' from any of the four technical indicators
drop down choices a 'Slope period' input field will appear.
 'Slope' is the gradient of a linear regression line through the closing price of the stock for the selected period before the date the slope is plotted. So in the NASDAQ Comp. chart above the final value of the slope (-0.17) is the slope of a regression line for 10 sessions before May 31.
Slope values are normalized to be between -1 and plus 1. More on their Interpretation below.
How to interpret Slope
The slope chart can be used to determine short, medium and long term trends. You can experiment with different values for period but 10, 50 and 200 would be reasonable starting values.
The value of the slope chart is that it shows you when an uptrend is weakening as the slope gets less positive and the down trend may soon be turning upwards.
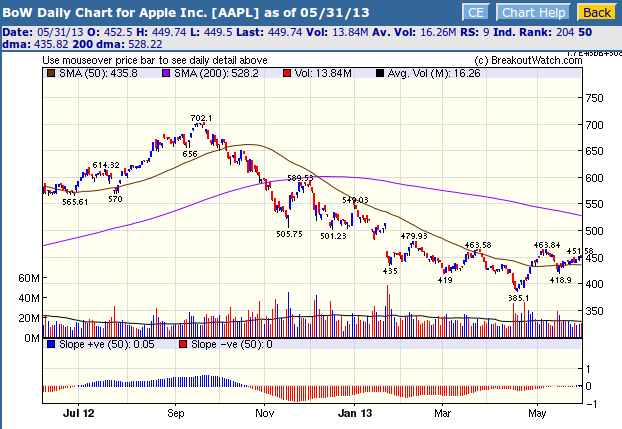
This chart of AAPL shows that the medium (50 day) term trend was down, even when there were attempts to rally.

Enjoy your new toy!
| Index | Value | Change Week | Change YTD | Trend | ||||||||||||||||||||||||||||||||||||
|---|---|---|---|---|---|---|---|---|---|---|---|---|---|---|---|---|---|---|---|---|---|---|---|---|---|---|---|---|---|---|---|---|---|---|---|---|---|---|---|---|
| Dow | 15115.6 | -1.23% | 15.35% | Down | ||||||||||||||||||||||||||||||||||||
| NASDAQ | 3455.91 | -0.09% | 14.45% | Down | ||||||||||||||||||||||||||||||||||||
| S&P 500 | 1630.74 | -1.14% | 14.34% | Down | ||||||||||||||||||||||||||||||||||||
1The Market Signal is derived
from our proprietary market model. The market model is
described on the site.
2The site also shows industry rankings based on fundamentals, combined technical and fundamentals, and on price alone. The site also shows daily industry movements. |
||||||||||||||||||||||||||||||||||||||||
|
# of Breakouts
|
Period Average1
|
Max. Gain During Period2
|
Gain at Period Close3
|
|
|---|---|---|---|---|
| This Week | 12 | 12.08 | 2.45% | 1.04% |
| Last Week | 8 | 11.92 | 6.24% | 2.14% |
| 13 Weeks | 189 | 12.85 | 11.08% |
2.64% |
2This represents the return if each stock were bought at its breakout price and sold at its intraday high.
3This represents the return if each stock were bought at its breakout price and sold at the most recent close.
|
Category
|
Symbol
|
Company Name
|
Expected Gain1
|
|---|---|---|---|
| Best Overall | HOV | Hovnanian Enterprises, Inc. | 102 |
| Top Technical | HOV | Hovnanian Enterprises, Inc. | 102 |
| Top Fundamental | RPXC | RPX Corp | 44 |
| Top Tech. & Fund. | RPXC | RPX Corp | 44 |
|
Category
|
Symbol
|
Company Name
|
Expected Gain1
|
|---|---|---|---|
| Best Overall | HOV | Hovnanian Enterprises, Inc. | 103 |
| Top Technical | CSII | Cardiovascular Systems Inc | 53 |
| Top Fundamental | EGHT | 8x8, Inc. | 92 |
| Top Tech. & Fund. | EGHT | 8x8, Inc. | 92 |
If you received this newsletter from a friend and you would like to receive it regularly please go to the BreakoutWatch.com site and enter as a Guest. You will then be able to register to receive the newsletter.
Copyright © 2013 NBIcharts, LLC dba BreakoutWatch.com. All rights
reserved.
" BreakoutWatch," the BreakoutWatch.com "eye" logo, and the slogan
"tomorrow's breakouts today" are service marks of NBIcharts LLC.
All other marks are the property of their respective owners, and
are used for descriptive purposes only.
BreakoutWatch is not affiliated with Investor's Business Daily or
with Mr. William O'Neil. Our site, research and analysis is
supported entirely by subscription and is free from advertising.