| Market Summary | Weekly Breakout Report | Top Breakout Choices | Top 2nd Chances | New Features | Tip of the Week |
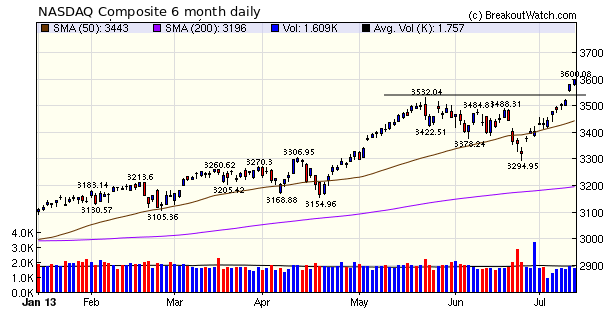
The NASDAQ Composite gapped up on Thursday, easily breaking through the resistance level of 3532 set back on May 22. The rally continued on Friday with the index easily outperforming the DJI and S&P 500 indexes. You will see from the chart that volume remains stubbornly low, with the volume on Thursday barely reaching the 50 day average despite the strong move upward. As a result our trend indicator for the NASDAQ remained on down as the move up wasn't confirmed by strong volume. Nevertheless, as we showed last week, our separate trend reversal signal charts show the rally is continuing so we have taken the unusual step of overriding the trend indicator and set it to 'up' as of last Thursday. I believe this decision will be confirmed this week as earnings season continues and corporations predominately beat earnings expectations. The news late Sunday that China's economy is slowing less than feared and the consequent bounce in Asian markets will surely carry through to the US markets on Monday.

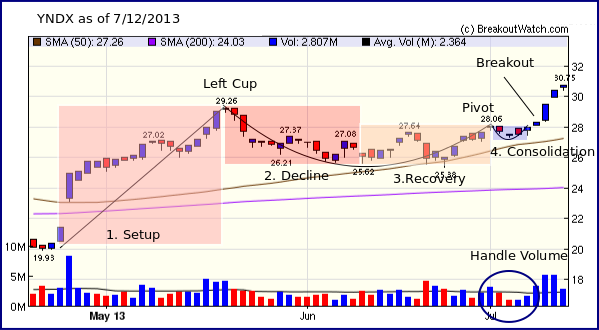
The low volume kept the number of confirmed breakouts down to 9 for the week. Russian internet company YANDEX (YNDX) was the top performer after breaking out from an almost textbook shallow cup-with-handle pattern on Tuesday and gaining 9.6% by Friday's close. To see why it is almost textbook, look at out tip of the week.
Our entry-level site, essential.breakoutwatch.com received a boost this week with the correction of a bug and the addition of two new features that deliver extra value for the bargain price of just $19.95 a month.
- A bug which prevented the Alert Monitor form showing was corrected. That version of the alert monitor is driven by a Google Docs spreadsheet. Although not as fully featured as the alert Monitor on the main site, it does offer real-time indications of when our watchlist stocks have reached their breakout price.
- Our EPS trends tool is now available through essential.breakoutwatch.com.
- Our Trend Reversal Signals are also available through essential.breakoutwatch.com
                Recognizing
                    a textbook cup-with-handle


                  Back in 2005 we
                  wrote an article describing why a cup with handle forms forms
                  and the desirable features of the pattern. See Anatomy
                    of a Anatomy of a Cup-with-Handle Chart Pattern
Although
                  the pattern occurs quite frequently, it is often difficult to
                  identify with just the naked eye, which is why our recognition
                  algorithm is so valuable.
                  The chart of YANDEX (YNDX), which broke out this week, is a
                  good example of a near perfect CwH chart.


                  In particular, note that the handle volume is exactly what we
                  should look for with a sharp decline after forming the pivot,
                  and then increasing volume before breakout.


                  You might also notice that there is in fact a first attempt at
                  a CwH pattern with the pivot at 27.64 on June 18. However, the
                  handle that then formed did not have a well defined volume
                  pattern and the breakout which formed the final pivot at 28.06
                  was initially weak before the better handle formed leading to
                  a strong breakout.
| Index | Value | Change Week | Change YTD | Trend | ||||||||||||||||||||||||||||||||||||
|---|---|---|---|---|---|---|---|---|---|---|---|---|---|---|---|---|---|---|---|---|---|---|---|---|---|---|---|---|---|---|---|---|---|---|---|---|---|---|---|---|
| Dow | 15464.3 | 2.17% | 18.01% | Up | ||||||||||||||||||||||||||||||||||||
| NASDAQ | 3600.08 | 3.47% | 19.23% | Up | ||||||||||||||||||||||||||||||||||||
| S&P 500 | 1680.19 | 2.96% | 17.81% | Up | ||||||||||||||||||||||||||||||||||||
1The Market Signal is derived
from our proprietary market model. The market model is
described on the site.
2The site also shows industry rankings based on fundamentals, combined technical and fundamentals, and on price alone. The site also shows daily industry movements. |
||||||||||||||||||||||||||||||||||||||||
|
# of Breakouts
|
Period Average1
|
Max. Gain During Period2
|
Gain at Period Close3
|
|
|---|---|---|---|---|
| This Week | 9 | 10.69 | 5.66% | 2.74% |
| Last Week | 2 | 10.54 | 10.49% | 5.57% |
| 13 Weeks | 139 | 11.23 | 16.34% |
9.8% |
2This represents the return if each stock were bought at its breakout price and sold at its intraday high.
3This represents the return if each stock were bought at its breakout price and sold at the most recent close.
|
Category
|
Symbol
|
Company Name
|
Expected Gain1
|
|---|---|---|---|
| Best Overall | PZN | Pzena Investment Management, Inc. | 98 |
| Top Technical | PZN | Pzena Investment Management, Inc. | 98 |
| Top Fundamental | MFRM | Mattress Firm Holding Corp | 42 |
| Top Tech. & Fund. | MFRM | Mattress Firm Holding Corp | 42 |
|
Category
|
Symbol
|
Company Name
|
Expected Gain1
|
|---|---|---|---|
| Best Overall | REGI | Renewable Energy Group Inc | 59 |
| Top Technical | REGI | Renewable Energy Group Inc | 59 |
| Top Fundamental | AWAY | HomeAway, Inc. | 42 |
| Top Tech. & Fund. | AWAY | HomeAway, Inc. | 42 |
If you received this newsletter from a friend and you would like to receive it regularly please go to the BreakoutWatch.com site and enter as a Guest. You will then be able to register to receive the newsletter.
Copyright © 2013 NBIcharts, LLC dba BreakoutWatch.com. All rights
reserved.
" BreakoutWatch," the BreakoutWatch.com "eye" logo, and the slogan
"tomorrow's breakouts today" are service marks of NBIcharts LLC.
All other marks are the property of their respective owners, and
are used for descriptive purposes only.
BreakoutWatch is not affiliated with Investor's Business Daily or
with Mr. William O'Neil.
Our site, research and analysis is supported entirely by
subscription and is free from advertising.