Breakoutwatch Weekly Summary 03/18/17
You are receiving this email because you are or were a BreakoutWatch.com subscriber, or have subscribed to our weekly newsletter. This newsletter summarizes the breakout events of the week and provides additional guidance that does not fit into our daily format. It is published each weekend.
| A sever snowstorm in the northeast
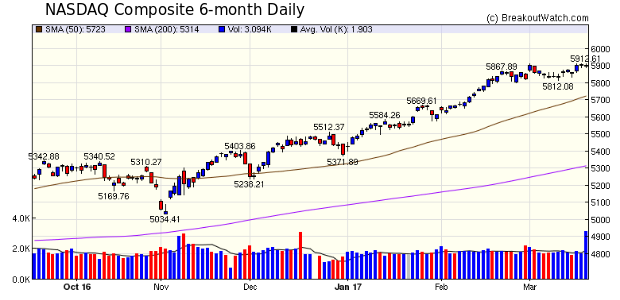
kept volumes low on the first two days of the week but volume
returned on Wednesday and the index set another new all-time high
on Friday as volume almost doubled the 50 day average. Volatility Squeeze breakouts dominated the number of breakouts for the week with Clovis Oncology topping the leader board. The RS Rank of CLVS was 99 on the day before breakout which is consistent with my general advise that a high RS Rank is the most consistent guide to a strong breakout.  |
| No new features this week
|
|
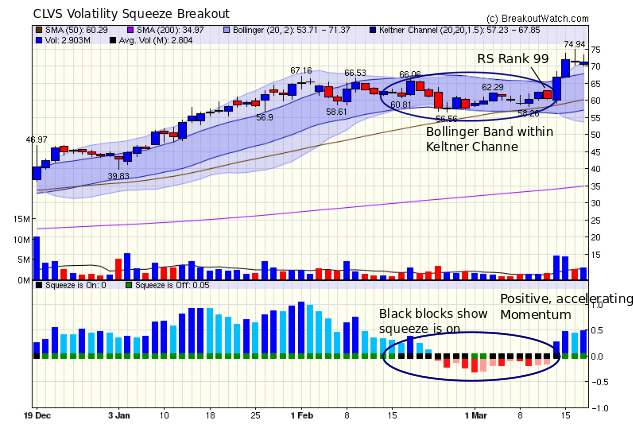
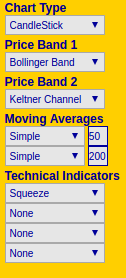
Our latest strategy suggestions are here. Understanding the Volatility Squeeze Next to the cup-and-handle pattern, we have found that the Volatility Squeeze (SQZ) provides the most successful breakouts. A SQZ occurs when a stocks volatility falls below its recent levels. The assumption is that sooner or later volatility will rise again and as it does, the price will rise (or fall) and so we look for a breakout as the volatility rises. We identify a SQZ as occurring when the Bollinger Band moves inside the Keltner Channel. For a breakout to occur we require that the upper Bollinger Band move above the upper Keltner Channel and that momentum be positive and accelerating. The chart for CLVS illustrates this concept.  This chart was produced with our Technical Analysis chart settings of  For a full explanation of the
Volatility Squeeze, read our methodology
page.
|
| List | Breakouts | Avg. Gain |
|---|---|---|
| CWH | 8 | 1.05 |
| SQZ | 18 | 5.3 |
| HTF | 1 | -9.49 |
| HSB | 0 | |
| DB | 1 | -9.03 |
| Brkout Date | Symbol | Base | Squeeze | BrkoutOut Price | Brkout Day Close | RS Rank* | Last Close | Current % off BOP | Gain at Intraday High |
|---|---|---|---|---|---|---|---|---|---|
| 2017-03-14 | CLVS | SQZ | y | 60.55 | 67 | 99 | 71.32 | 17.79% | 23.77% |
| 2017-03-15 | ARCO | SQZ | y | 6.36 | 8 | 93 | 7.35 | 15.57% | 24.21% |
| 2017-03-14 | KMG | SQZ | y | 38.48 | 44 | 87 | 43.22 | 12.32% | 16.35% |
| 2017-03-13 | VEEV | CWH | y | 45.85 | 47 | 82 | 49.79 | 8.59% | 8.68% |
| 2017-03-14 | WIFI | SQZ | y | 11.83 | 12 | 84 | 12.78 | 8.03% | 8.71% |
| 2017-03-16 | RNET | SQZ | y | 19.56 | 20 | 85 | 20.95 | 7.11% | 8.64% |
| 2017-03-15 | CLVS | SQZ | y | 66.94 | 72 | 99 | 71.32 | 6.54% | 11.95% |
| 2017-03-13 | LOGI | SQZ | y | 29.58 | 31 | 95 | 31.47 | 6.39% | 6.86% |
| 2017-03-15 | EDU | CWH | n | 52.54 | 54 | 83 | 55.1 | 4.87% | 5.98% |
| 2017-03-16 | YPF | SQZ | y | 22.29 | 24 | 86 | 23.3 | 4.53% | 6.86% |
| 2017-03-15 | WIFI | SQZ | y | 12.23 | 13 | 86 | 12.78 | 4.5% | 5.15% |
| 2017-03-17 | CASH | SQZ | y | 88.26 | 91 | 90 | 91.35 | 3.5% | 4.01% |
| 2017-03-17 | KS | SQZ | y | 23.15 | 24 | 88 | 23.74 | 2.55% | 3.84% |
| 2017-03-15 | DLNG | SQZ | y | 16.96 | 17 | 88 | 17.32 | 2.12% | 2.77% |
| 2017-03-17 | HBNC | SQZ | y | 26.14 | 27 | 87 | 26.57 | 1.64% | 1.95% |
| 2017-03-17 | ICUI | SQZ | y | 156.01 | 158 | 83 | 158.3 | 1.47% | 1.95% |
| 2017-03-16 | GNMK | CWH | n | 12.66 | 13 | 93 | 12.79 | 1.03% | 3% |
| 2017-03-17 | MEI | CWH | n | 45.95 | 46 | 87 | 46.3 | 0.76% | 0.87% |
| 2017-03-16 | MB | CWH | n | 27.41 | 28 | 96 | 27.6 | 0.69% | 2.7% |
| 2017-03-17 | CSFL | SQZ | y | 26.32 | 26 | 92 | 26.48 | 0.61% | 1.14% |
| 2017-03-17 | FFBC | SQZ | y | 28.66 | 29 | 85 | 28.75 | 0.31% | 0.94% |
| 2017-03-17 | PICO | SQZ | y | 14.31 | 14 | 80 | 14.35 | 0.28% | 3.42% |
| 2017-03-17 | KFY | SQZ | y | 32.39 | 32 | 82 | 32.43 | 0.12% | 0.4% |
| 2017-03-17 | NRG | CWH | y | 18.06 | 18 | 91 | 18.06 | 0% | 2.77% |
| 2017-03-13 | TEDU | CWH | n | 18.50 | 19 | 91 | 18.23 | -1.46% | 1.62% |
| 2017-03-15 | CYTK | CWH | n | 13.20 | 14 | 93 | 12.4 | -6.06% | 3.79% |
| 2017-03-15 | VRTV | DB | n | 57.60 | 62 | 83 | 52.4 | -9.03% | 8.68% |
| 2017-03-13 | CALA | HTF | n | 13.70 | 15 | 99 | 12.4 | -9.49% | 8.76% |
| *RS Rank on day before breakout. | |||||||||
| Symbol | BO Price |
BO Vol. |
Company | Industry | RS Rank |
Last Close |
|---|---|---|---|---|---|---|
| BZUN | 16.20 | 686,271 | Baozun Inc. | Catalog & Mail Order Houses | 95 | 15.21 |
| These stocks meet our suggested screening factors
for our Cup and Handle Chart Pattern watchlist. See Revised Rules for Trading Cup and Handle Breakouts |
||||||
| Index | Value | Change Week | Change YTD | Trend1 |
|---|---|---|---|---|
| Dow | 20914.6 |
0.06% | 5.83% | Up |
| NASDAQ | 5901 |
0.67% | 9.62% | Up |
| S&P 500 | 2378.25 |
0.24% | 6.23% | Up |
|
1The Market Trend is derived from
our proprietary market model. The market model is described on
the sitehere.
2The site also shows industry rankings based on fundamentals, combined technical and fundamentals, and on price alone. The site also shows daily industry movements. |
||||
| 1 Week | 13 Weeks | 26 Weeks | Year-to-Date |
|---|---|---|---|
| NASDAQ Composite |
NASDAQ Composite 5.4 % |
Dow Jones 15.4 % |
NASDAQ Composite 9.62 % |
| 1 Week | 3 Weeks | 13 Weeks | 26 Weeks |
|---|---|---|---|
| General Entertainment |
Regional - Southwest Banks |
Basic Materials Wholesale |
Regional - Southwest Banks |
| Processing Systems & Products 68 |
Beverages - Wineries & Distillers 91 |
Home Health Care 150 |
Long Distance Carriers 202 |
| Charts of each industry rank and performance over 12 months are available on the site | |||
If you received this newsletter from a friend and you would like to receive it regularly please go to the BreakoutWatch.com site and you will then be able to register to receive the newsletter.
Copyright (c) 03/18/2017 NBIcharts, LLC dba BreakoutWatch.com. All
rights reserved.
" BreakoutWatch," the BreakoutWatch.com "eye" logo, and the slogan
"tomorrow's breakouts today" are service marks of NBIcharts LLC. All
other marks are the property of their respective owners, and are used
for descriptive purposes only.
BreakoutWatch is not affiliated with Investor's Business Daily or with Mr. William O'Neil. Our site, research and analysis is supported entirely by subscription and is free from advertising.