Breakoutwatch Weekly Summary 08/05/17
You are receiving this email because you are or were a BreakoutWatch.com subscriber, or have subscribed to our weekly newsletter. This newsletter summarizes the breakout events of the week and provides additional guidance that does not fit into our daily format. It is published each weekend.
| Strong upward moves in Handle
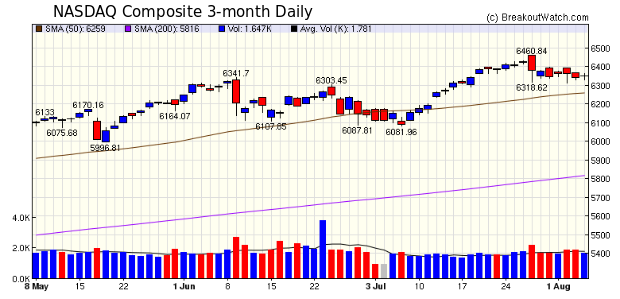
Portend Strong Breakout I'm back from my European vacation and newsletters are resuming. While the DJI registered its eighth straight consecutive new high on Friday the NASDAQ and S&P 500 are lagging with a loss of 0.4% for the NASDAQ and a gain of just 0.2% for the S&P. While our market trend signal for the NASDAQ continues to be positive, there have been some negative signs with four distribution days in the last seven sessions (see our latest equivaluechart). Most likely this is nervousness on the part of investors following the high on July 26 causing consolidation and the upward trend should resume next week following Friday's strong economic report.  The short retreat from the July
26 high allowed several handles to form resulting in 16
breakouts from the cup and handle pattern this week with an
average gain of 5%. The strongest breakout, ESIO, would have
been difficult to ride as it gapped up by 16% over its
breakout price which greatly exceeds our suggestion of not to
buy above 5% from the BoP. On the other hand the second
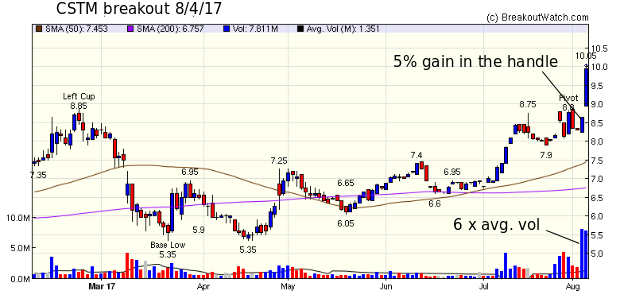
most successful breakout, CSTM, gapped up by just 2% after
rising 5% the day before on 6 times average daily volume.
Moves like that before breakout are a strong signal that a
strong breakout is likely. Here is the CSTM chart.
 |
| No new features this week |
| List | Breakouts | Avg. Gain |
|---|---|---|
| CWH | 16 | 5.06 |
| SQZ | 1 | -3.51 |
| HTF | 0 | |
| HSB | 1 | 2.6 |
| DB | 0 |
| Brkout Date | Symbol | Base | Squeeze | BrkoutOut Price | Brkout Day Close | RS Rank* | Last Close | Current % off BOP | Gain at Intraday High |
|---|---|---|---|---|---|---|---|---|---|
| 2017-08-03 | ESIO | CWH | n | 8.96 | 10 | 92 | 10.43 | 16.41% | 16.52% |
| 2017-07-31 | CSTM | CWH | n | 8.75 | 9 | 88 | 9.95 | 13.71% | 14.86% |
| 2017-08-04 | AJRD | CWH | n | 23.95 | 27 | 86 | 27.225 | 13.67% | 13.7% |
| 2017-08-04 | CSTM | CWH | n | 8.80 | 10 | 94 | 9.95 | 13.07% | 14.2% |
| 2017-08-02 | FMC | CWH | n | 78.30 | 84 | 92 | 84.35 | 7.73% | 8.63% |
| 2017-08-04 | IBP | CWH | n | 55.10 | 59 | 90 | 58.7 | 6.53% | 8.89% |
| 2017-08-01 | CGNX | CWH | n | 95.46 | 105 | 96 | 100.34 | 5.11% | 10.42% |
| 2017-08-01 | TREX | CWH | n | 76.11 | 77 | 83 | 79.67 | 4.68% | 7.79% |
| 2017-07-31 | PAH | CWH | n | 13.88 | 14 | 85 | 14.45 | 4.11% | 6.77% |
| 2017-08-04 | BLDR | CWH | n | 16.06 | 17 | 83 | 16.695 | 3.95% | 4.3% |
| 2017-08-02 | AGIO | CWH | n | 59.39 | 62 | 85 | 61.52 | 3.59% | 6.23% |
| 2017-08-04 | CRR | HSB | n | 7.31 | 8 | 10 | 7.5 | 2.6% | 2.74% |
| 2017-08-02 | AAPL | CWH | n | 153.54 | 157 | 82 | 156.295 | 1.79% | 2.52% |
| 2017-08-03 | COT | CWH | n | 15.70 | 16 | 82 | 15.915 | 1.37% | 1.85% |
| 2017-08-04 | SJW | CWH | n | 55.60 | 56 | 80 | 55.67 | 0.13% | 1.91% |
| 2017-07-31 | NPO | CWH | n | 75.71 | 77 | 83 | 74.33 | -1.82% | 2.56% |
| 2017-08-01 | INGN | SQZ | y | 94.39 | 96 | 95 | 91.08 | -3.51% | 4.17% |
| 2017-08-01 | AXTI | CWH | n | 8.80 | 9 | 97 | 7.65 | -13.07% | 3.98% |
| *RS Rank on day before breakout. | |||||||||
| Symbol | BO Price |
BO Vol. |
Company | Industry | RS Rank |
Last Close |
|---|---|---|---|---|---|---|
| MOMO | 46.33 | 10,214,216 | Momo Inc. | Internet Software & Services | 98 | 44.05 |
| NEFF | 21.25 | 217,005 | Neff Corporation | Rental & Leasing Services | 97 | 21.10 |
| IRBT | 109.78 | 1,661,244 | iRobot Corporation | Appliances | 97 | 102.81 |
| MOD | 17.85 | 497,292 | Modine Manufacturing Company | Auto Parts | 96 | 17.20 |
| LITE | 68.63 | 2,615,090 | Lumentum Holdings Inc. | Money Center Banks | 96 | 58.85 |
| RILY | 20.35 | 187,689 | B. Riley Financial | Asset Management | 95 | 18.45 |
| CVGI | 8.95 | 409,784 | Commercial Vehicle Group | Auto Parts Wholesale | 95 | 8.85 |
| BEAT | 35.40 | 574,012 | BioTelemetry | Medical Laboratories & Research | 95 | 33.90 |
| GDOT | 40.84 | 435,914 | Green Dot Corporation | Credit Services | 95 | 39.67 |
| EDU | 82.89 | 1,808,859 | New Oriental Education & Technology Group | Education & Training Services | 95 | 79.10 |
| These stocks meet our suggested screening factors
for our Cup and Handle Chart Pattern watchlist. See Revised Rules for Trading Cup and Handle Breakouts |
||||||
| Index | Value | Change Week | Change YTD | Trend1 |
|---|---|---|---|---|
| Dow | 22092.8 |
1.2% | 11.79% | Up |
| NASDAQ | 6351.56 |
-0.36% | 17.99% | Up |
| S&P 500 | 2476.83 |
0.19% | 10.63% | Up |
|
1The Market Trend is derived from
our proprietary market model. The market model is described on
the sitehere.
2The site also shows industry rankings based on fundamentals, combined technical and fundamentals, and on price alone. The site also shows daily industry movements. |
||||
| 1 Week | 13 Weeks | 26 Weeks | Year-to-Date |
|---|---|---|---|
| Dow Jones |
Dow Jones 4.11 % |
NASDAQ Composite 12.08 % |
NASDAQ Composite 17.99 % |
| 1 Week | 3 Weeks | 13 Weeks | 26 Weeks |
|---|---|---|---|
| Aluminum |
Aluminum |
Resorts & Casinos |
Consumer Services |
| Semiconductor - Memory Chips 164 |
Semiconductor - Memory Chips 155 |
Semiconductor - Memory Chips 174 |
Semiconductor - Memory Chips 181 |
| Charts of each industry rank and performance over 12 months are available on the site | |||
If you received this newsletter from a friend and you would like to receive it regularly please go to the BreakoutWatch.com site and you will then be able to register to receive the newsletter.
Copyright (c) 08/05/2017 NBIcharts, LLC dba BreakoutWatch.com. All
rights reserved.
" BreakoutWatch," the BreakoutWatch.com "eye" logo, and the slogan
"tomorrow's breakouts today" are service marks of NBIcharts LLC. All
other marks are the property of their respective owners, and are used
for descriptive purposes only.
BreakoutWatch is not affiliated with Investor's Business Daily or with Mr. William O'Neil. Our site, research and analysis is supported entirely by subscription and is free from advertising.