Breakoutwatch Weekly Summary 08/19/17
You are receiving this email because you are or were a BreakoutWatch.com subscriber, or have subscribed to our weekly newsletter. This newsletter summarizes the breakout events of the week and provides additional guidance that does not fit into our daily format. It is published each weekend.
| Volatility Squeeze Pattern
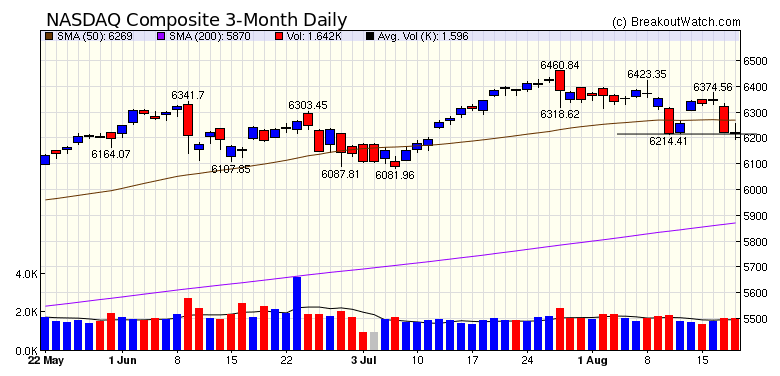
Outperforms Cup and Handle Our market trend indicators remain positive after the NASDAQ composite found support on Friday at the previous Friday's low. Despite the 0.6% loss for the week, the NASDAQ recorded only one distribution day which occurred on Thursday as rumors spread that economic adviser Gary Cohn planned to resign. The market opened lower still on Friday but news of the firing of Steve Bannon lifted spirits for a while but a selloff at the close left the index with 0.1% loss on the day.  Volumes were well below average until Thursday which hurt the number of breakouts as did Thursday's loss. The result was we recorded only 5 confirmed breakouts for the week. Unusually, cup and handle pattern stocks did not perform well with the best performer of the week coming from the Volatility Squeeze pattern. See below for a recap of how that works. |
| No new features this week
|
|
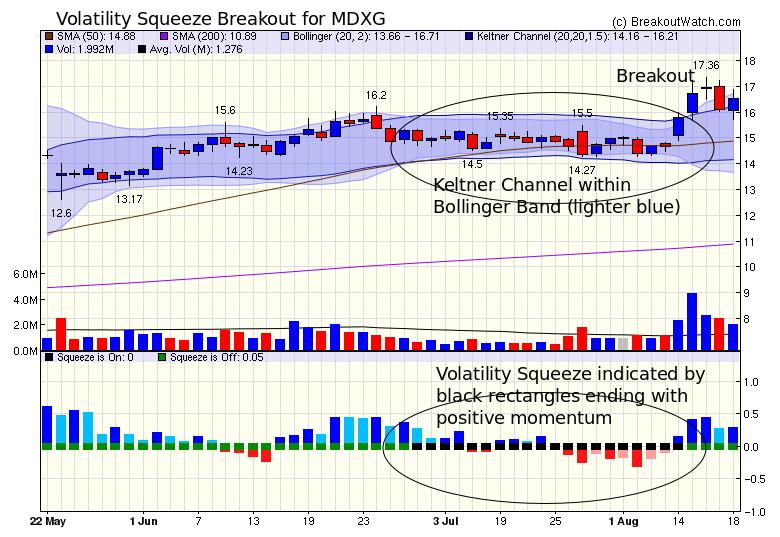
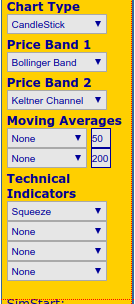
Our latest strategy suggestions are here. The Volatility Squeeze pattern is the second most prolific performer of the patterns we study. A "Volatility Squeeze" occurs when the volatility of a stock falls below its recent levels. A fall in volatility usually means that the stock is in a period of consolidation and trending in a narrow range. When that period of consolidation ends, normal volatility will return resulting in a breakout to the upside or downside. If we can recognize a volatility squeeze situation, then we have the opportunity to place a long or short position order and profit from the breakout. We detect a "squeeze" when the 2 standard deviation Bollinger Band (BB) narrows to within the Keltner Channel (KC). Bollinger Bands are very susceptible to volatility changes while Keltner Channels are a smoother, trend following, indicator. Consequently, the narrowing of the BB to within the KC gives us a convenient means of algorithmicly recognizing a drop in volatility. However, we only publish stocks in a Volatility Squeeze when the stock is trending up with positive and increasing momentum. This week's breakout of allograft producer MDXG provides an opportunity to review a Volatility Squeeze (SQZ) breakout in action. The chart below shows the relevant features of the SQZ. Note also that volume increased significantly and momentum became positive on the day before the breakout. We emphasize frequently that a significant volume rise increases the probability of breakout.   The
chart above is produced using the chart settings shown
on the right. Our Volatility Squeeze watchlist produces
charts like this for all stocks on that watchlist. The
chart above is produced using the chart settings shown
on the right. Our Volatility Squeeze watchlist produces
charts like this for all stocks on that watchlist. |
| List | Breakouts | Avg. Gain |
|---|---|---|
| CWH | 3 | -0.26 |
| SQZ | 2 | 2.3 |
| HTF | 0 | |
| HSB | 0 | |
| DB | 0 |
| Brkout Date | Symbol | Base | Squeeze | BrkoutOut Price | Brkout Day Close | RS Rank* | Last Close | Current % off BOP | Gain at Intraday High |
|---|---|---|---|---|---|---|---|---|---|
| 2017-08-15 | MDXG | SQZ | y | 15.79 | 17 | 96 | 16.52 | 4.62% | 9.94% |
| 2017-08-14 | BEAT | CWH | n | 35.40 | 37 | 96 | 35.675 | 0.78% | 4.94% |
| 2017-08-15 | CDI | CWH | n | 8.25 | 8 | 85 | 8.275 | 0.3% | 0.91% |
| 2017-08-15 | PRAH | SQZ | y | 74.78 | 76 | 90 | 74.76 | -0.03% | 2.57% |
| 2017-08-16 | HBM | CWH | n | 8.05 | 8 | 89 | 7.9 | -1.86% | 1.61% |
| *RS Rank on day before breakout. | |||||||||
| Symbol | BO Price |
BO Vol. |
Company | Industry | RS Rank |
Last Close |
|---|---|---|---|---|---|---|
| LHCG | 65.55 | 251,120 | LHC Group | Home Health Care | 94 | 64.31 |
| NAV | 31.72 | 1,018,276 | Navistar International Corporation | Trucks & Other Vehicles | 94 | 30.35 |
| HOFT | 44.40 | 111,488 | Hooker Furniture Corporation | Home Furnishings & Fixtures | 93 | 41.15 |
| COR | 111.77 | 481,930 | CoreSite Realty Corporation | REIT - Office | 93 | 110.14 |
| MNTX | 8.78 | 97,214 | Manitex International | Diversified Machinery | 92 | 8.33 |
| These stocks meet our suggested screening factors
for our Cup and Handle Chart Pattern watchlist. See Revised Rules for Trading Cup and Handle Breakouts |
||||||
| Index | Value | Change Week | Change YTD | Trend1 |
|---|---|---|---|---|
| Dow | 21674.5 |
-0.84% | 9.67% | Up |
| NASDAQ | 6216.53 |
-0.64% | 15.48% | Up |
| S&P 500 | 2425.55 |
-0.65% | 8.34% | Up |
|
1The Market Trend is derived from
our proprietary market model. The market model is described on
the site here.
2The site also shows industry rankings based on fundamentals, combined technical and fundamentals, and on price alone. The site also shows daily industry movements. |
||||
| 1 Week | 13 Weeks | 26 Weeks | Year-to-Date |
|---|---|---|---|
| NASDAQ Composite |
Dow Jones 2.18 % |
NASDAQ Composite 6.47 % |
NASDAQ Composite 15.48 % |
| 1 Week | 3 Weeks | 13 Weeks | 26 Weeks |
|---|---|---|---|
| Appliances |
Aluminum |
Appliances |
Resorts & Casinos |
| Drug Related Products 189 |
Foreign Utilities 162 |
Publishing - Books 169 |
Publishing - Books 202 |
| Charts of each industry rank and performance over 12 months are available on the site | |||
If you received this newsletter from a friend and you would like to receive it regularly please go to the BreakoutWatch.com site and you will then be able to register to receive the newsletter.
Copyright (c) 08/19/2017 NBIcharts, LLC dba BreakoutWatch.com. All
rights reserved.
" BreakoutWatch," the BreakoutWatch.com "eye" logo, and the slogan
"tomorrow's breakouts today" are service marks of NBIcharts LLC. All
other marks are the property of their respective owners, and are used
for descriptive purposes only.
BreakoutWatch is not affiliated with Investor's Business Daily or with Mr. William O'Neil. Our site, research and analysis is supported entirely by subscription and is free from advertising.