Breakoutwatch Weekly Summary 02/03/18
You are receiving this email because you are or were a BreakoutWatch.com subscriber, or have subscribed to our weekly newsletter. This newsletter summarizes the breakout events of the week and provides additional guidance that does not fit into our daily format. It is published each weekend.
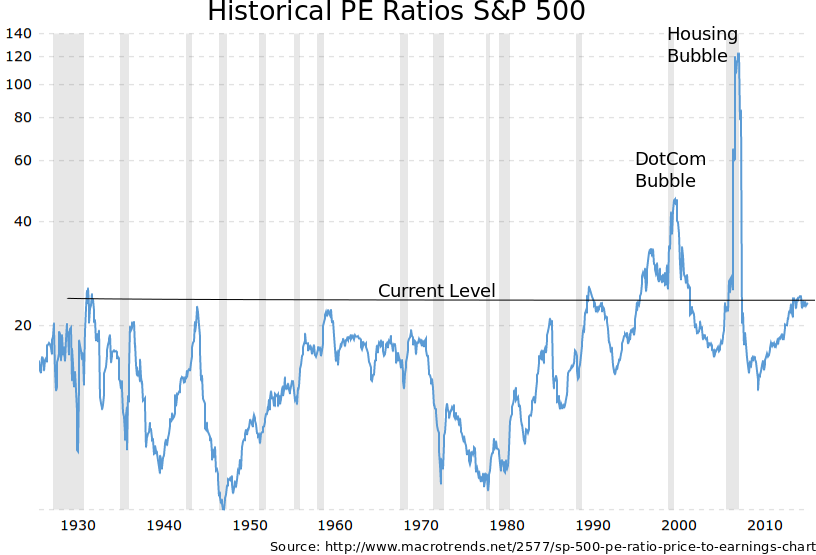
Profit Taking Inevitable After PE Ratio's Above Most Historic Highs  After posting a new high last
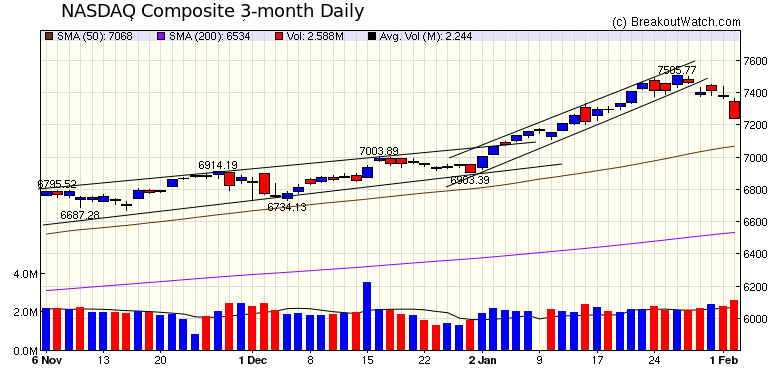
Friday, the NASDAQ Composite dropped 3.5% this week, while the
other two major indexes slid slightly more. Looking at the trend
lines I've marked on the the chart, it is not hard to see why
this week's decline was inevitable, at least at some point.
Since the start of the year the index has moved up more sharply
and daily volatility (the width of the upper and lower trend
lines) decreased showing increasing confidence in the upward
trend. But that couldn't continue as PE ratio's reached historic
highs and some profit taking was inevitable.
While Friday's 666 point drop in the DJI may sound huge, in percentage terms, which is what really matters, the drop was only 2.5% and the NASDAQ's drop of 2% was even less. While we might see the fall continue into next week, particularly as another possible government shut-down looms, I expect the NASDAQ will find support near or above the 50 day average. The economic fundamentals are strong as a result of the massive 1.5T stimulus given to the economy, twice that of the Obama stimulus in 2008, and so corporate profits and dividends are almost certain to continue to move higher. Our market trend signals for all three indexes continue to point higher. |
| Errors in the major indexes intraday charts which appear on the Alerts page have been corrected. |
|
Our latest strategy
suggestions are here.
|
| List | Breakouts | Avg. Gain |
|---|---|---|
| CWH | 14 | 1.99 |
| SQZ | 18 | 1.93 |
| HTF | 0 | |
| HSB | 0 | |
| DB | 0 |
| Brkout Date | Symbol | Base | Squeeze | BrkoutOut Price | Brkout Day Close | RS Rank* | Last Close | Current % off BOP | Gain at Intraday High |
|---|---|---|---|---|---|---|---|---|---|
| 2018-01-29 | QBAK | SQZ | y | 8.80 | 9.21 | 91 | 10.99 | 24.89% | 24.89% |
| 2018-01-29 | FOR | SQZ | y | 21.96 | 22.15 | 88 | 25.6 | 16.58% | 20.17% |
| 2018-01-30 | FOR | SQZ | y | 22.16 | 22.35 | 89 | 25.6 | 15.52% | 19.09% |
| 2018-01-31 | FOR | SQZ | y | 22.36 | 24.4 | 90 | 25.6 | 14.49% | 18.02% |
| 2018-01-31 | IMGN | CWH | n | 8.67 | 9.18 | 96 | 9.76 | 12.57% | 15.8% |
| 2018-01-29 | TWIN | CWH | n | 28.69 | 31.34 | 87 | 31.03 | 8.16% | 11.36% |
| 2018-01-29 | MOD | CWH | n | 23.15 | 23.25 | 89 | 24.35 | 5.18% | 7.56% |
| 2018-01-30 | QADA | CWH | n | 42.65 | 42.7 | 82 | 44.65 | 4.69% | 6.33% |
| 2018-02-01 | EZPW | CWH | n | 12.50 | 13.5 | 82 | 13 | 4% | 10% |
| 2018-01-30 | WIFI | SQZ | y | 23.48 | 23.58 | 90 | 24.09 | 2.6% | 3.75% |
| 2018-02-02 | LJPC | CWH | n | 37.82 | 38.59 | 83 | 38.59 | 2.04% | 7.85% |
| 2018-02-01 | OPY | SQZ | y | 27.51 | 28.25 | 93 | 28.05 | 1.96% | 3.6% |
| 2018-02-01 | CME | CWH | y | 156.49 | 158.91 | 80 | 159.11 | 1.67% | 4.16% |
| 2018-01-29 | FBR | CWH | n | 17.15 | 17.43 | 90 | 17.43 | 1.63% | 5.13% |
| 2018-02-01 | ERI | SQZ | y | 34.56 | 34.65 | 95 | 35 | 1.27% | 2.14% |
| 2018-02-01 | KAI | SQZ | y | 100.26 | 102.35 | 82 | 100.9 | 0.64% | 2.53% |
| 2018-01-29 | CVTI | SQZ | y | 28.83 | 29.52 | 82 | 29.01 | 0.62% | 4.86% |
| 2018-02-02 | RGC | CWH | n | 23.09 | 23.1 | 82 | 23.1 | 0.04% | 0.3% |
| 2018-01-29 | LBC | SQZ | y | 12.93 | 12.98 | 99 | 12.79 | -1.08% | 1.62% |
| 2018-01-29 | RST | SQZ | y | 12.67 | 12.83 | 80 | 12.53 | -1.1% | 2.45% |
| 2018-02-01 | CVTI | SQZ | y | 29.34 | 30 | 84 | 29.01 | -1.12% | 3.03% |
| 2018-02-01 | AMN | CWH | n | 54.25 | 54.8 | 87 | 53.55 | -1.29% | 2.58% |
| 2018-02-01 | MANT | SQZ | y | 52.08 | 52.31 | 84 | 51.25 | -1.59% | 0.58% |
| 2018-02-01 | RST | SQZ | y | 12.79 | 12.87 | 83 | 12.53 | -2.03% | 1.49% |
| 2018-01-30 | EXTR | CWH | n | 14.60 | 15.08 | 94 | 14.3 | -2.05% | 6.51% |
| 2018-02-01 | IGT | CWH | n | 29.51 | 29.64 | 85 | 28.84 | -2.27% | 1.29% |
| 2018-02-01 | VRTX | CWH | n | 171.26 | 172.99 | 87 | 166.24 | -2.93% | 2.16% |
| 2018-01-30 | ENV | CWH | n | 54.70 | 55.05 | 82 | 52.75 | -3.56% | 1.37% |
| 2018-01-29 | ALDX | SQZ | y | 7.46 | 7.6 | 87 | 7.1 | -4.83% | 3.08% |
| 2018-01-30 | IBP | SQZ | y | 73.51 | 73.9 | 86 | 66.8 | -9.13% | 3.05% |
| 2018-01-29 | INAP | SQZ | y | 16.63 | 17.02 | 83 | 14.9 | -10.4% | 8.48% |
| 2018-01-30 | INAP | SQZ | y | 17.03 | 17.11 | 87 | 14.9 | -12.51% | 2.47% |
| *RS Rank on day before breakout. | |||||||||
| Symbol | BO Price |
BO Vol. |
Company | Industry | RS Rank |
Last Close |
|---|---|---|---|---|---|---|
| CYRX | 9.26 | 150,836 | CryoPort - Inc. - Common Stock | Packaging & Containers | 97 | 8.56 |
| ASMB | 50.99 | 244,828 | Assembly Biosciences - Inc. - Common Stock | Drug Manufacturers - Major | 97 | 46.57 |
| PNK | 33.63 | 1,134,840 | Pinnacle Entertainment - Inc. - Common Stock | Resorts & Casinos | 95 | 33.38 |
| BZUN | 39.98 | 3,445,413 | Baozun Inc. - American Depositary Shares | Catalog & Mail Order Houses | 95 | 35.27 |
| These stocks meet our suggested screening factors
for our Cup and Handle Chart Pattern watchlist. See Revised Rules for Trading Cup and Handle Breakouts |
||||||
| Index | Value | Change Week | Change YTD | Trend1 |
|---|---|---|---|---|
| Dow | 25521 |
-4.12% | 3.24% | Up |
| NASDAQ | 7240.95 |
-3.53% | 4.89% | Up |
| S&P 500 | 2762.13 |
-3.85% | 3.31% | Up |
|
1The Market Trend is derived from
our proprietary market model. The market model is described on
the site here.
2The site also shows industry rankings based on fundamentals, combined technical and fundamentals, and on price alone. The site also shows daily industry movements. |
||||
| 1 Week | 13 Weeks | 26 Weeks | Year-to-Date |
|---|---|---|---|
| NASDAQ Composite |
Dow Jones 8.42 % |
Dow Jones 15.52 % |
NASDAQ Composite 4.89 % |
| 1 Week | 3 Weeks | 13 Weeks | 26 Weeks |
|---|---|---|---|
| Auto Parts Wholesale |
Auto Parts Wholesale |
Auto Parts Wholesale |
Resorts & Casinos |
| Synthetics 99 |
Long Distance Carriers 108 |
Synthetics 168 |
Personal Computers 215 |
| Charts of each industry rank and performance over 12 months are available on the site | |||
If you received this newsletter from a friend and you would like to receive it regularly please go to the BreakoutWatch.com site and you will then be able to register to receive the newsletter.
Copyright (c) 02/03/2018 NBIcharts, LLC dba BreakoutWatch.com. All
rights reserved.
" BreakoutWatch," the BreakoutWatch.com "eye" logo, and the slogan
"tomorrow's breakouts today" are service marks of NBIcharts LLC. All
other marks are the property of their respective owners, and are used
for descriptive purposes only.
BreakoutWatch is not affiliated with Investor's Business Daily or with Mr. William O'Neil. Our site, research and analysis is supported entirely by subscription and is free from advertising.