Breakoutwatch Weekly Summary 02/10/18
You are receiving this email because you are or were a BreakoutWatch.com subscriber, or have subscribed to our weekly newsletter. This newsletter summarizes the breakout events of the week and provides additional guidance that does not fit into our daily format. It is published each weekend.
| Volatility Returns. Adjust Trailing
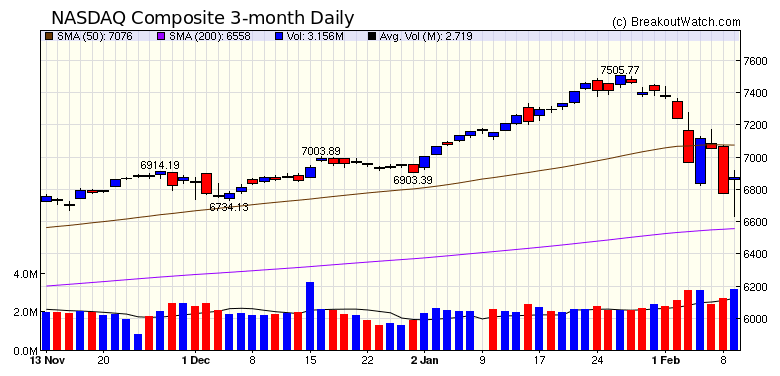
Stops Accordingly. Watch Market Signals Without entering into the debate about what caused the markets to crash this week, the most important lesson to be drawn is that volatility, which took a holiday during 2017, is back. This has implications for our suggested trading strategy and these are discussed below. Our trend model for the DJI and S&P 500 turned down on Monday and for the NASDAQ on Wednesday. It is strongly suggested that long positions not be opened while the trend model remains negative. All three major indexes lost over 5% for the week, although the NASDAQ did lose slightly less than the other two. Although there are long term concerns about the damage the budget deficit and tax cuts may do to the economy, it is likely that these will have a short term stimulus effect and that corporate profits will improve during 2018. What is unknown is to what extent this was already factored into share prices before this week's adjustment. Prices may continue to unwind next week, although Friday's strong accumulation day and mid-day reversal may have signaled that we have already seen the immediate bottom. I expect that once our trend model again turns positive, the upward trend will continue during 2018 barring some external event.  |
| No new features this week. |
|
Trailing Stops
Require Adjusting
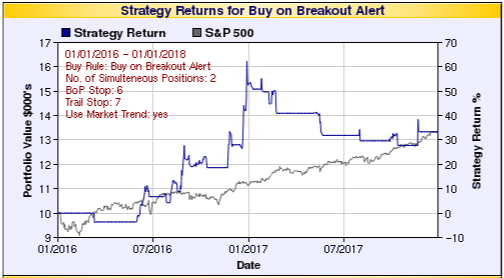
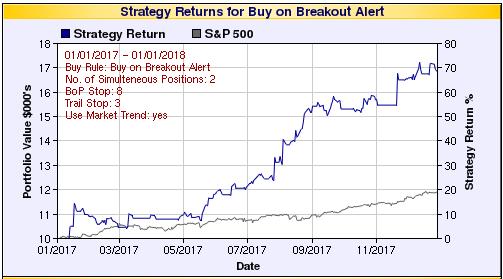
The purpose of trailing stops is to limit losses when a stock loses value. Prior to 2016, we suggested using a trailing stop of 7% and during 2016 our backtest model shows this was quite successful. We did not adjust that suggestion during 2017, and the result was that the model performed negatively as shown in this image reproduced from the back test tool covering the years 2016- 2017. The failure of the model from the start of 2017 is clear. Volatility was low (the S&P 500 never fell more than 2% during 2017) and the model held on to poorly performing stocks longer than it should have.  Adjusting the model for 2017 with a trail stop of 3% shows how the model should have performed. Poorly performing stocks were sold quickly so more profitable ones could be bought.  Market volatility this week
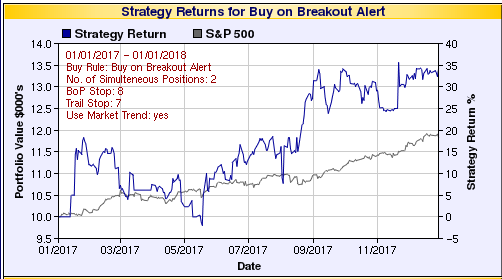
suggests that a return to the 7% trailing stop would be
prudent. Adjusting our current Buy at Open Strategy,
taking advantage of new indicators introduced since the
start of the year, with a 7% trailing stop shows that
during 2017 the model would still have produced an
excellent return.
 |
| List | Breakouts | Avg. Gain |
|---|---|---|
| CWH | 2 | 6.11 |
| SQZ | 3 | 0.93 |
| HTF | 0 | |
| HSB | 0 | |
| DB | 0 |
| Brkout Date | Symbol | Base | Squeeze | BrkoutOut Price | Brkout Day Close | RS Rank* | Last Close | Current % off BOP | Gain at Intraday High |
|---|---|---|---|---|---|---|---|---|---|
| 2018-02-07 | QBAK | CWH | n | 10.99 | 11.78 | 95 | 11.7 | 6.46% | 16.01% |
| 2018-02-09 | MCFT | CWH | n | 24.89 | 26.32 | 85 | 26.32 | 5.75% | 7.47% |
| 2018-02-09 | HLG | SQZ | y | 49.08 | 51.19 | 99 | 51.19 | 4.3% | 4.44% |
| 2018-02-09 | RDWR | SQZ | y | 20.66 | 20.86 | 82 | 20.86 | 0.97% | 1.5% |
| 2018-02-07 | ZGNX | SQZ | y | 38.71 | 38.8 | 98 | 37.75 | -2.48% | 3.33% |
| *RS Rank on day before breakout. | |||||||||
| Symbol | BO Price |
BO Vol. |
Company | Industry | RS Rank |
Last Close |
|---|---|---|---|---|---|---|
| CYRX | 9.26 | 151,005 | CryoPort - Inc. - Common Stock | Packaging & Containers | 97 | 7.86 |
| FBR | 18.03 | 2,174,332 | Fibria Celulose S.A. | Paper & Paper Products | 94 | 16.52 |
| MOD | 24.90 | 563,124 | Modine Manufacturing Company Common Stock | Auto Parts | 94 | 23.00 |
| These stocks meet our suggested screening factors
for our Cup and Handle Chart Pattern watchlist. See Revised Rules for Trading Cup and Handle Breakouts |
||||||
| Index | Value | Change Week | Change YTD | Trend1 |
|---|---|---|---|---|
| Dow | 24190.9 |
-5.21% | -2.14% | Down |
| NASDAQ | 6874.49 |
-5.06% | -0.42% | Down |
| S&P 500 | 2619.55 |
-5.16% | -2.02% | Down |
|
1The Market Trend is derived from
our proprietary market model. The market model is described on
the site here.
2The site also shows industry rankings based on fundamentals, combined technical and fundamentals, and on price alone. The site also shows daily industry movements. |
||||
| 1 Week | 13 Weeks | 26 Weeks | Year-to-Date |
|---|---|---|---|
| NASDAQ Composite |
Dow Jones 3.28 % |
Dow Jones 10.67 % |
NASDAQ Composite -0.42 % |
| 1 Week | 3 Weeks | 13 Weeks | 26 Weeks |
|---|---|---|---|
| Auto Parts Wholesale |
Auto Parts Wholesale |
Auto Parts Wholesale |
Resorts & Casinos |
| Advertising Agencies 86 |
Sporting Goods 84 |
Drug Related Products 141 |
Medical Practitioners 215 |
| Charts of each industry rank and performance over 12 months are available on the site | |||
If you received this newsletter from a friend and you would like to receive it regularly please go to the BreakoutWatch.com site and you will then be able to register to receive the newsletter.
Copyright (c) 02/10/2018 NBIcharts, LLC dba BreakoutWatch.com. All
rights reserved.
" BreakoutWatch," the BreakoutWatch.com "eye" logo, and the slogan
"tomorrow's breakouts today" are service marks of NBIcharts LLC. All
other marks are the property of their respective owners, and are used
for descriptive purposes only.
BreakoutWatch is not affiliated with Investor's Business Daily or with Mr. William O'Neil. Our site, research and analysis is supported entirely by subscription and is free from advertising.